
Resources
3 min read
Redis, which stands for remote dictionary server, is an open-source, in-memory data structure store that is commonly used as a database, cache, and message broker. Utilizing Redis provides numerous benefits for your team and organization, which have helped drive the tool's increase in popularity. A key example of this is speed, Redis works primarily in memory, making it particularly fast for data operations. This makes it a great solution for caching regularly accessed data or executing real-time analytics where speed is crucial. Additionally, the tool is incredibly versatile. Redis supports numerous data structures such as strings, hashes, lists, sets, and sorted sets. This versatility enables developers to use Redis for a broad variety of use cases including caching, session storage, leaderboards, message queues, and more.
However, whilst Redis presents extensive advantages to teams and organizations that adopt it, it isn’t without its constraints. Primarily due to complexity, as deployments differ in complexity, from standalone instances to highly distributed setups with replication, clustering, and sharding. As well as the tool's in-memory nature, meaning that when monitoring, data must be captured and analyzed in real time. These difficulties can impact the users' ability to effectively monitor and analyze deployments.
Due to these challenges incorporating an effective Redis monitoring tool is crucial for managing and enhancing Redis deployments. These monitoring tools offer administrators the visibility, insights, and capabilities they require to monitor, examine, and optimize the performance, reliability, and security of Redis instances. But, with there being a broad range of these tools available it can be difficult to make the correct choice for your organization.
So, to assist you in understanding the importance and benefits of Redis monitoring tools, within this article, we will explain what a Redis monitoring tool is and list the leading tools currently available to assist your decision-making process.
Contents
What is a Redis Monitoring Tool?
A Redis monitoring tool is a software application or service designed to track the health, performance, and usage metrics of Redis instances. These tools supply insights into numerous aspects of Redis, such as memory usage, CPU utilization, throughput, latency, and more. They commonly provide features like real-time monitoring, historical data analysis, alerting, and visualization of metrics.
Racompass
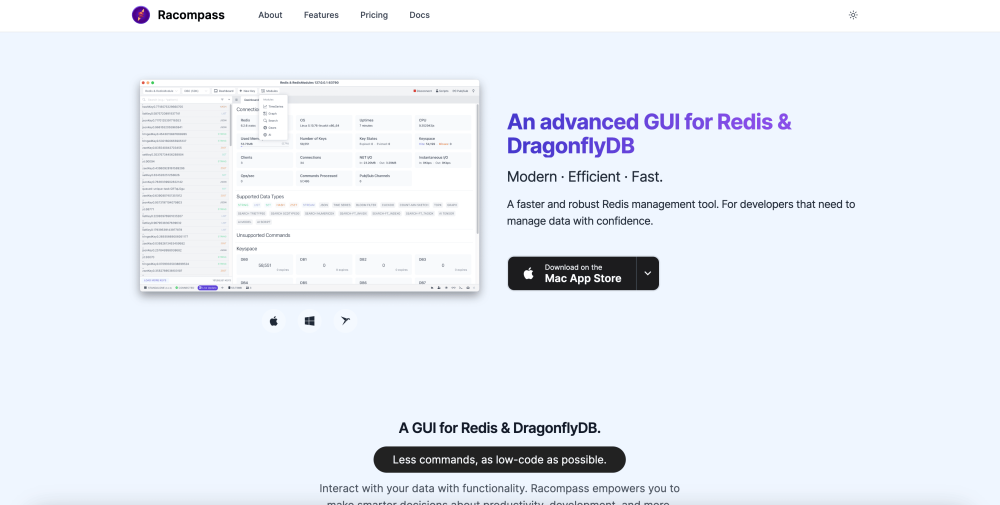
Racompass describes itself as a faster and more robust Redis GUI management tool. The tool offers numerous connection modes such as standalone, Sentinel, and Cluster providing management possibilities for these connections that make it simpler to look up master/slave nodes and slots. In addition to this, this Redis monitoring tool utilizes various data types including string, hash, and stream.
SolarWinds
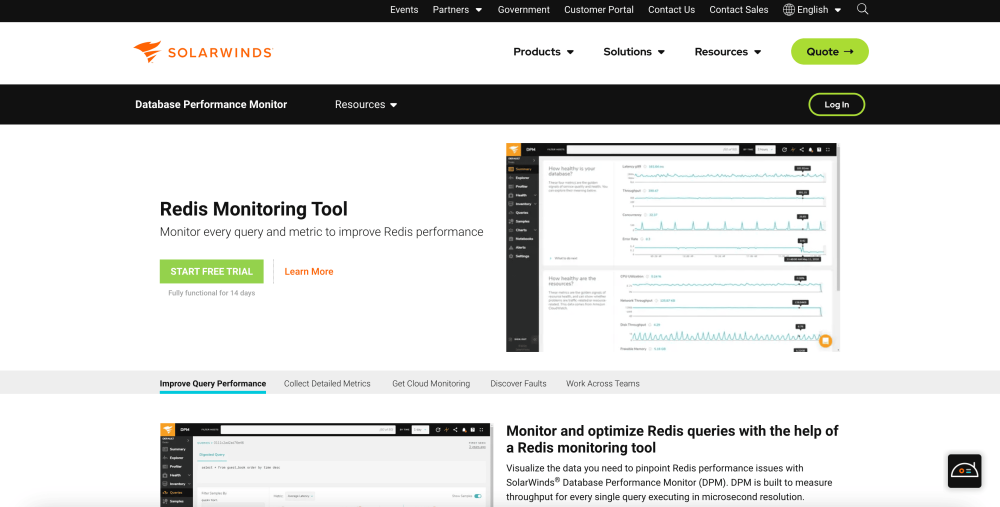
With SolarWinds’ Redis monitoring tool, you can enhance your Redis performance by tracking every query and metric. The tool uses advanced techniques including regression analysis and queueing theory to deliver insights. As well as this, the solution provides adaptive fault detection technology that can assist you in finding and addressing faults before they become outages.
Logit.io
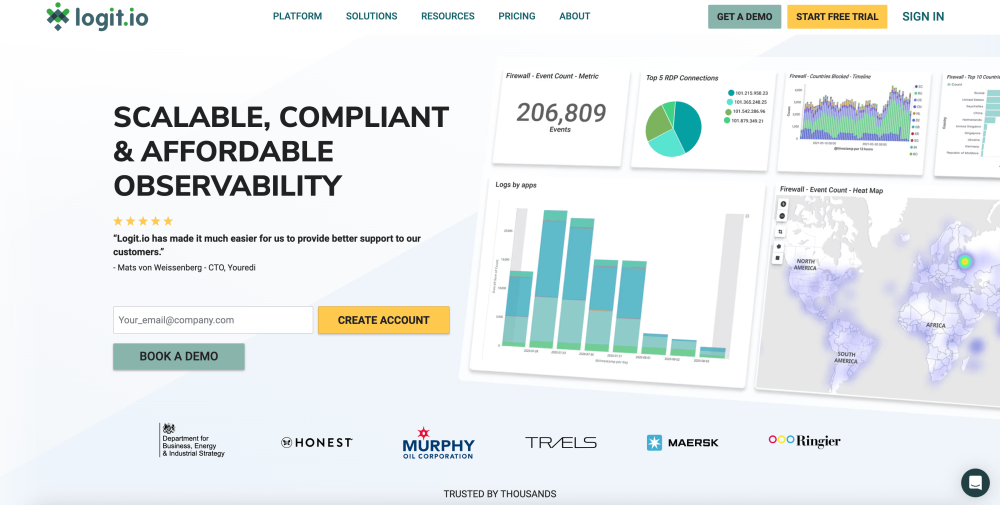
Utilizing Logit.io as a Redis monitoring tool is straightforward and offers a host of advantages. The most appropriate method for this is to use Logit.io's Hosted Prometheus solution.
Logit.io is a powerful observability platform that offers extensive capabilities for monitoring, analyzing, and enhancing your systems, applications, and servers. The Logit.io platform offers Hosted Prometheus and Grafana which can be launched straight from the Logit.io dashboard enabling you to easily begin utilizing the tools powerful visualizing capabilities for monitoring and analysis.
You can begin by configuring Prometheus with a Redis exporter such as open-source exporter. Then for Kubernetes orchestration, you will have to run Redis in pods. To do this you wil deploy a sidecar exporter in the same Redis pod. This way, the Redis exporter can talk to the Redis service on the localhost port. Then you will use a simple annotation on your pod and Prometheues can start scraping the metrics from that pod. These metrics can be almost instantly monitored straight from the Logit.io platform and provide you with real-time monitoring, alerting, and visualizations.
Medis 2
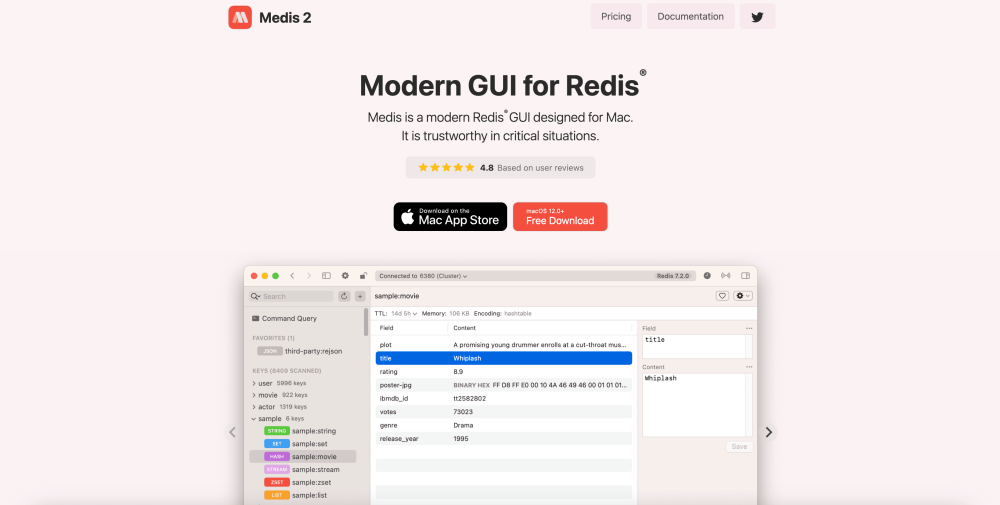
Medis is a Redis GUI designed for Mac. It is compatible with numerous data types such as strings, sets, sorted sets, streams, and even third-party modules like RedisJSON. This Redis monitoring tool offers a query view, enabling you to execute arbitrary commands. As well as this, the tool recognizes various data formats automatically so you don’t need to be concerned if you are using MessagePack for reducing memory usage.
ManageEngine Applications Manager
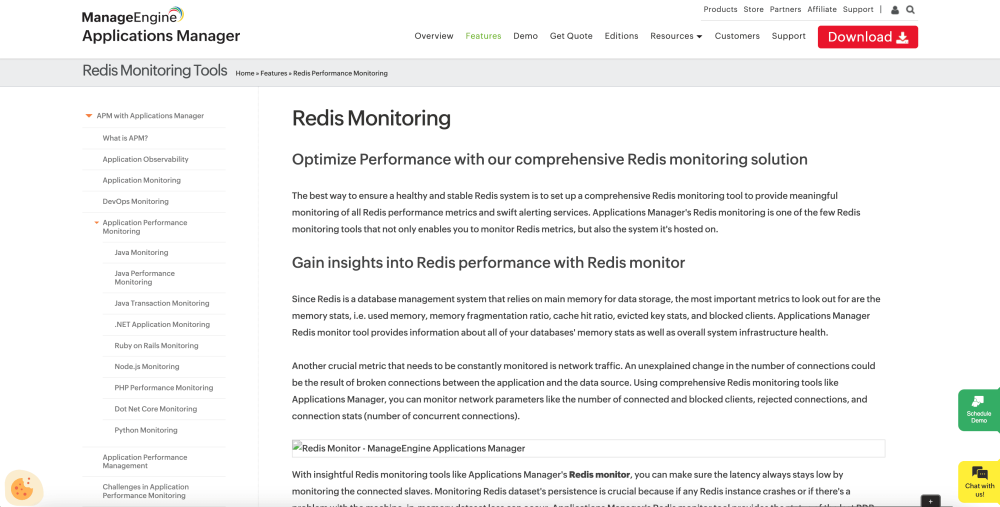
ManageEngine’s Applications Manager offers Redis monitoring capabilities that offer insights into the memory statistics of all your databases, along with the general health of your system infrastructure. As well as this the tool aggregates critical metrics to help you visualize them through reports. You can access reports for every attribute, including their historical trends, and compare attribute reports across different databases.
Sematext
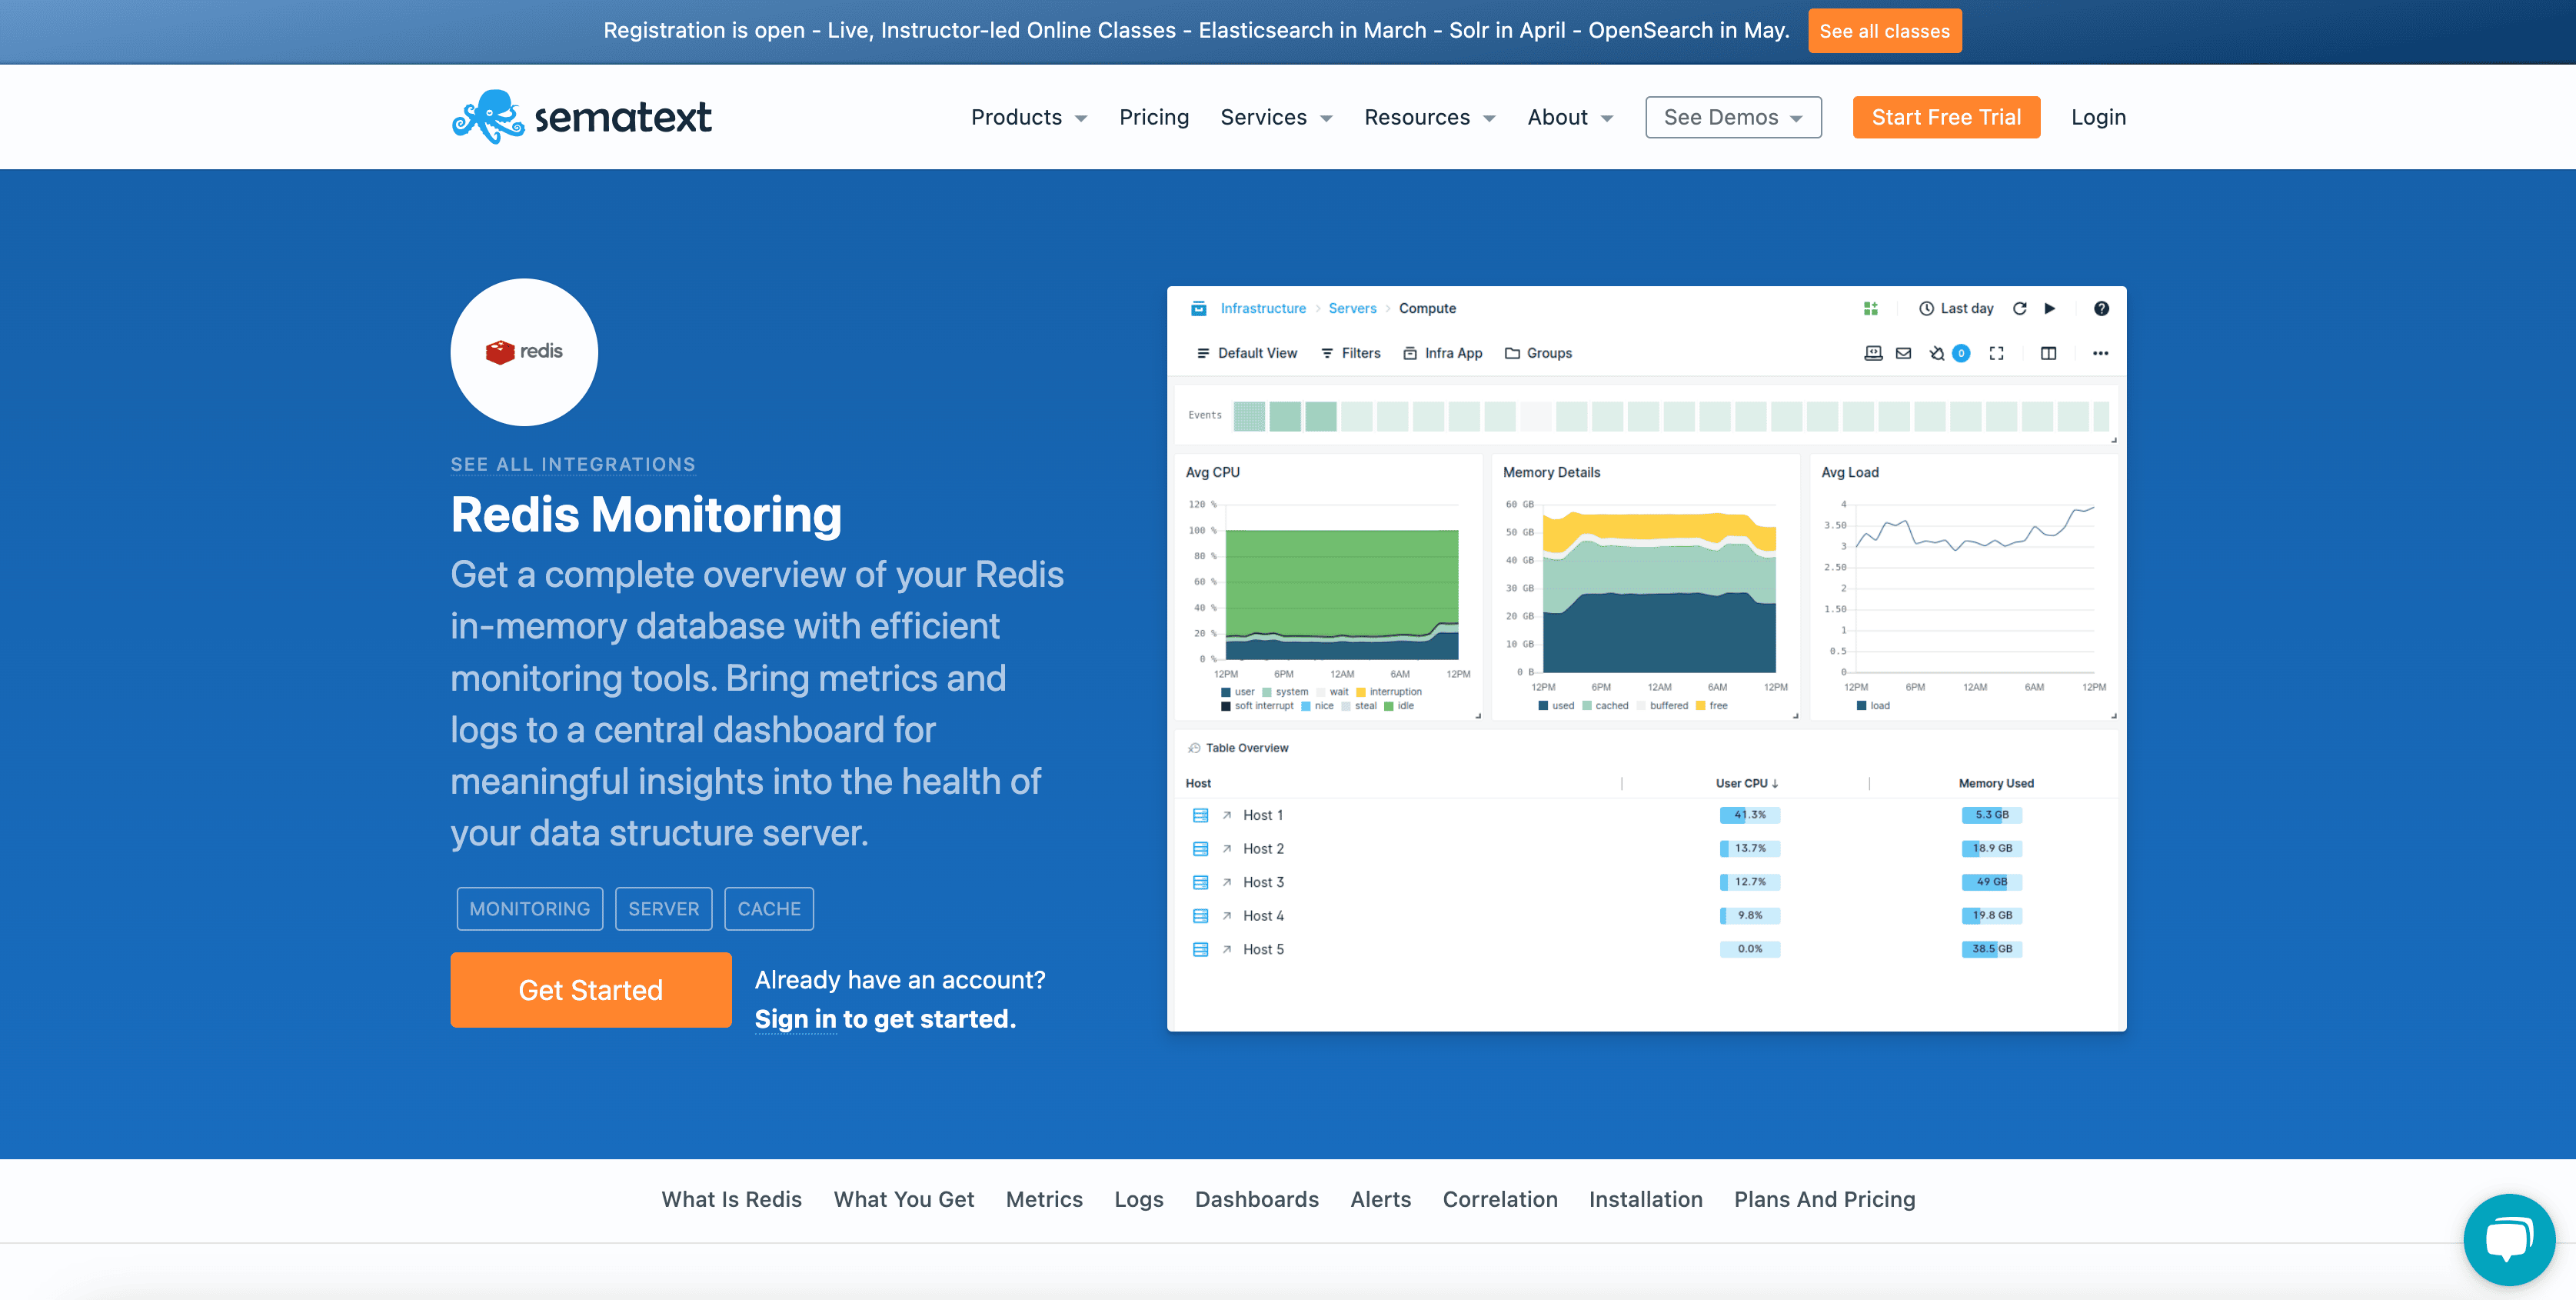
With Sematext’s solution, you can utilize the Redis integration to use Sematext as a Redis monitoring tool. The solution enables you to ship logs and metrics to a central dashboard to offer insights into the health of your data structure server. Also, you can use the tool to Enhance performance and deliver quicker applications to users can be achieved by monitoring Redis statistics, including used memory, evictions, and commands.
Redis Assistant
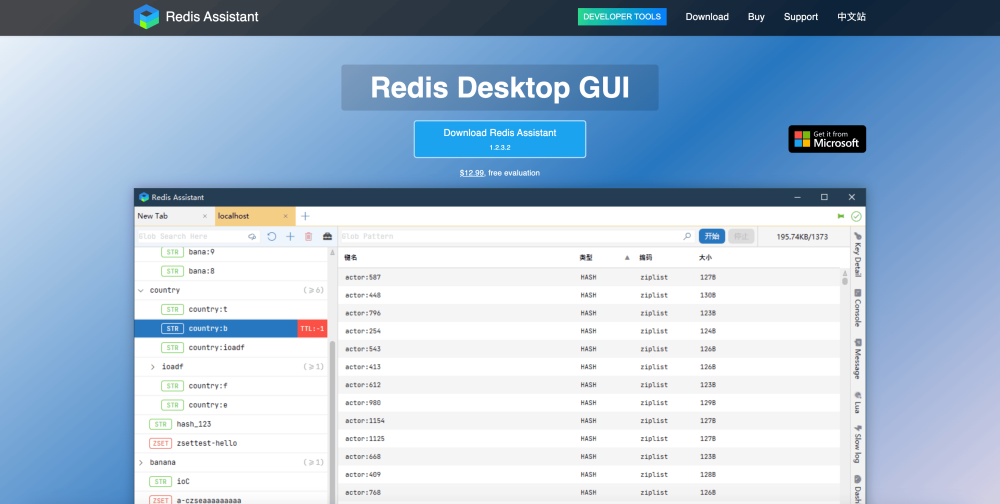
The Redis Assistant is (as the name suggests) a Redis desktop GUI that assists with Redis monitoring. The solution promises to be smooth and stable even whilst processing extensive amounts of keys and fields. In addition to this, the tool renders the interface by making full use of GPU, which will lead to higher fluidity and less resource usage of the software.
New Relic
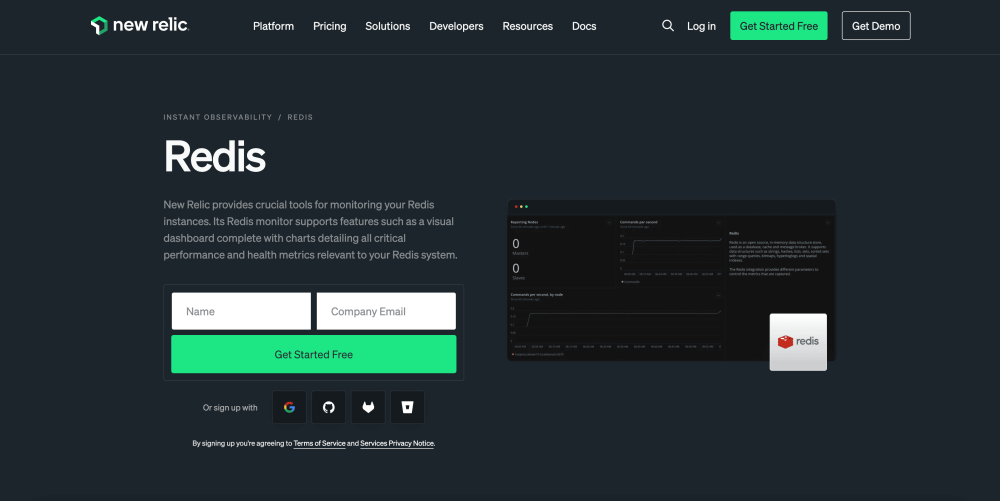
With New Relics Redis monitoring tool you can utilize dashboards and alerts to monitor your Redis instances. The dashboards are interactive visualizations that make exploring your data, understanding context, and resolving problems simpler and quicker. Also, the tools alerts detect changes in critical metrics and fire alerts that help to lessen the time spent to rectify issues. You can configure alerts for blocked clients and anomalies in current connections.
Appliku
Appliku is a bring-your-own-server(BYOS) deployment service. The solution can be utilized as a Redis monitoring tool by connecting a cloud provider and Redis as the supported database. Appliku will handle the setup and configuration of your apps. Then, your applications are deployed from your git repository and require minimal configuration, making it simple to begin monitoring your Redis database metrics.
Datadog
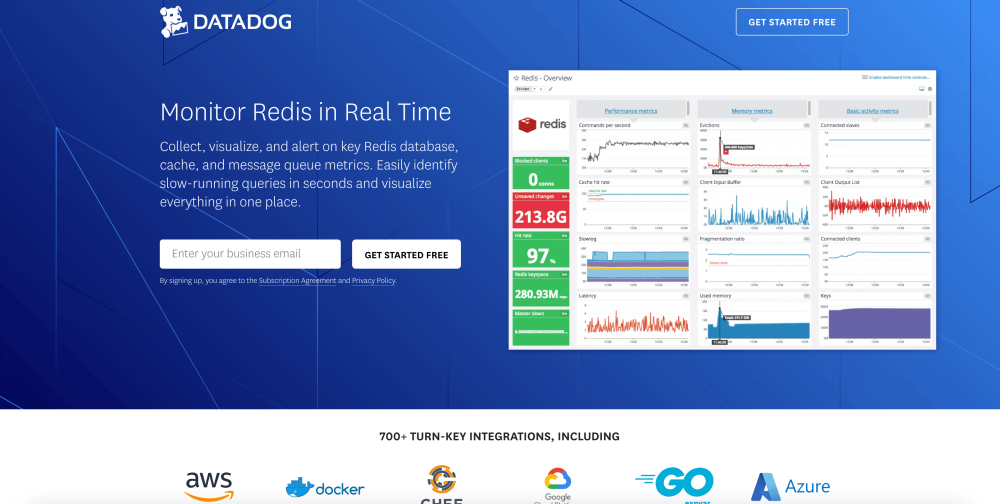
The final Redis monitoring tool on our list is Datadog, which enables monitoring in real-time by collecting, visualizing, and alerting on key Redis database, cache, and message queue metrics. Datadog possesses’ over 700 turn-key integrations allowing for simpler configuration. The tool provides numerous advantages including the ability to improve memory management by gaining control over your memory footprint and prevent memory swapping and shutdowns with a real-time understanding of memory usage.
If you've enjoyed this article why not read our list of The Top 10 Server Monitoring Tools or The Top 8 Network Monitoring Tools next?