
Managed alerting for logs & metrics
Catch errors, spikes, and security signals early with managed ElastAlert 2 — 12 rule types and 45 destinations, without running alert infrastructure yourself.
Trusted by engineering teams worldwide



















































Logit.io provides managed ElastAlert 2 for Logs stacks: define YAML rules in the dashboard, test them, and route notifications to the tools your team already uses. Choose from 12 rule types and 45 destinations — including Slack, Microsoft Teams, PagerDuty, Opsgenie, ServiceNow, Jira, email, SMS, and custom webhooks.
Optional OpenSearch Alerting monitors and metrics alerts via Grafana complete the picture. Guides: Alerting documentation.
Managed alerting vs DIY
| Capability | Logit.io | Self-hosted ElastAlert |
|---|---|---|
| Infrastructure | Fully managed on your Logs stack | You run and scale alert workers |
| Destinations | 45 documented destinations | You wire and maintain each alerter |
| Rule authoring | Dashboard YAML editor + test | Files on disk / config repos only |
| Automation | Developer API for rules CRUD | Custom scripting against your host |
How alerting works on Logit.io
Enable Alerting & Notifications on your Logs stack, edit YAML rules in the dashboard, run Test only to validate parsing and query results, then Update when ready. Rules use the same OpenSearch query patterns you already know — managed infrastructure runs them for you.
Customize subject, body, context fields, Discover links, aggregation windows, and realert to control noise. Step-by-step: Create a new alerting rule.
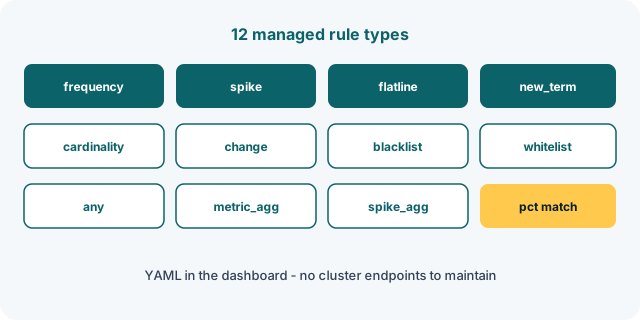
12 rule types for real incidents
Match the signal you care about — not just generic thresholds:
- frequency / spike / flatline — volume and silence detection
- new_term / change / cardinality — unexpected values and field drift
- blacklist / whitelist / any — allow and deny list matching
- metric_aggregation / spike_aggregation / percentage_match — metric-style conditions on log fields
Browse every type with examples in the rule types docs.
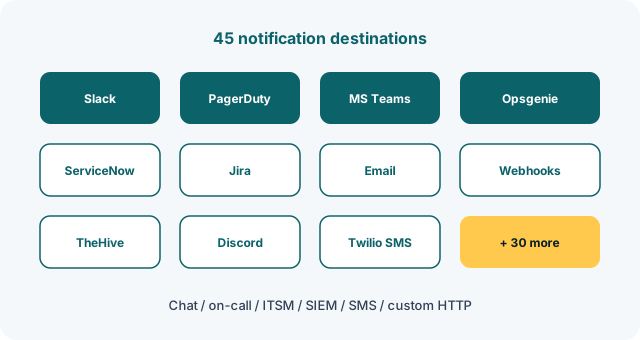
45 destinations — chat, on-call, ITSM, and more
Send alerts where work already happens: Slack, Microsoft Teams, PagerDuty, Opsgenie, ServiceNow, Jira, Discord, email, Twilio SMS, TheHive, Alertmanager, Grafana IRM, Amazon SNS/SQS/SES, and custom HTTP via post / post2 webhooks — 45 destinations documented with YAML options.
Full catalog: Alert destinations. Automate enable/disable and rule CRUD with the Developer API.
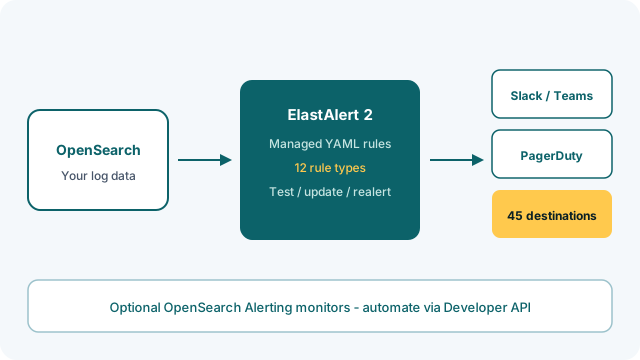
Logs, metrics, and OpenSearch monitors
Pair log alerting with metrics alerts (CPU, disk, RAM) and optional OpenSearch Alerting monitors for Dashboards-native workflows. Together with log management and security monitoring, you get one platform for detection and response.
Key benefits
Chat, on-call, ITSM, SIEM, SMS, and custom webhooks — documented with ready YAML examples.
Frequency, spike, flatline, new term, cardinality, aggregations, and more — without self-hosting ElastAlert.
Validate rules in the dashboard, then update when ready — reduce noisy false positives.
Enable alerting and manage rules via the Developer API for infrastructure-as-code workflows.
Companies Feel The Difference When They Use Logit.io
“One thing is certain when operating in the startup space, a strict budget. Before we make any purchase decision to use a SaaS Log Management platform, we need to validate the benefits of the platform and more importantly the team behind the platform.”
“Logit.io's customer support team stood out. Right from the beginning, the Logit.io team was there to answer questions and walk us through the process.”
Start your 14-day free trial
No credit card required. Managed OpenSearch, Prometheus, and Grafana from $25/mo.