
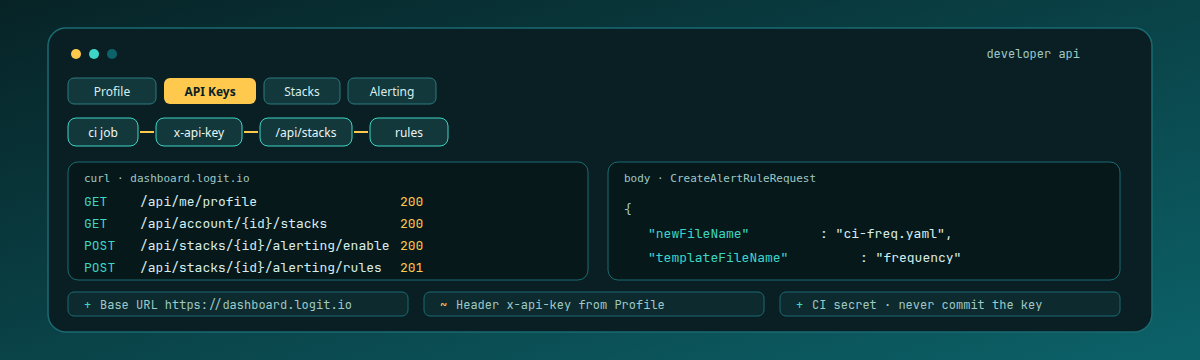

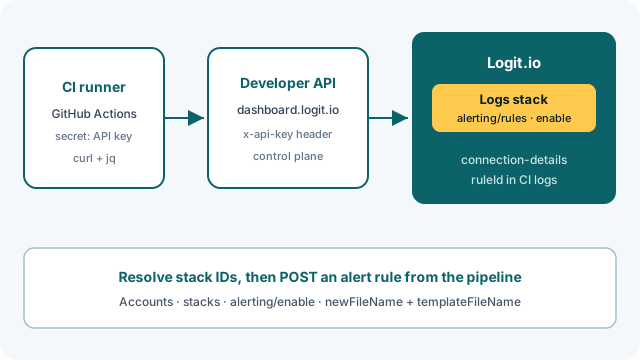
Shippers get logs into a stack. The Developer API is the other half: the control plane on https://dashboard.logit.io that lists stacks, pulls connection details, enables alerting, and creates rules. The first useful CI win is not an OpenAPI dump. It is a job that authenticates with x-api-key, resolves the Logs stack it is allowed to touch, and POSTs a rule you can see under that stack's alerting list.
Contents
Control plane, not another shipper
Fluent Bit, Filebeat, and Wazuh journeys teach you how data reaches Logstash SSL. This one stays above the data plane. You call account and stack endpoints, then alerting endpoints, with a Dashboard API key. Base URL and auth live in the Developer API overview: every request goes to https://dashboard.logit.io with the key in the x-api-key header.
That is also why inventing a create-stack POST will fail you. Public stack guides cover listing stacks, overview, connection-details, getting-started, statistics, upgrades, and audit log — see Managing Stacks via API. Provision the Logs stack in the dashboard first (or reuse one you already have). CI then discovers it by account ID and stack ID, and mutates alerting on that ID.
Mint a CI-scoped API key
Open the Logit.io dashboard, go to Profile, and create a key under API Keys. The value is shown once. The Getting Started quickstart and Authentication page both put that key in x-api-key. Store it as a CI secret (GitHub Actions secrets.LOGIT_DASHBOARD_API_KEY, or your vault). Never commit it.
Prove the secret before you touch stacks:
curl -H "x-api-key: $LOGIT_DASHBOARD_API_KEY" \
  https://dashboard.logit.io/api/me/profile
A 200 with profile fields and an apiKeys summary means the header is correct. A 401 usually means a truncated secret, a revoked key, or a value pasted with quotes and whitespace still attached. Rotate from Profile (or via the Profile and API Keys endpoints) if that key ever leaked into a PR log.
Prefer a dedicated key with a description such as CI/CD pipeline — the create-key body accepts an optional description field. That makes revocation boring when a runner pool turns over.
Unlock complete visibility with hosted ELK, Grafana, and Prometheus-backed Observability
Resolve the stack ID in the job
Hard-coding a stack GUID you copied last quarter is how staging alerts land on production. Resolve at runtime from Managing Stacks.
First list accounts:
curl -H "x-api-key: $LOGIT_DASHBOARD_API_KEY" \
  https://dashboard.logit.io/api/accounts
The response is a total plus results[]. Each account carries accountId (GUID), optional displayName, and enabled / paying flags. Pick the account your pipeline owns, then:
curl -H "x-api-key: $LOGIT_DASHBOARD_API_KEY" \
  https://dashboard.logit.io/api/account/$ACCOUNT_ID/stacks
That payload groups subscriptions and their stacks, including stack IDs and product names. Select the Logs stack your alert YAML is meant for — not a Metrics sibling, not an APM stack from another product line. Docs placeholders use @logs_id for Logs and @metrics_id for Metrics; in CI you substitute the real ID from this list.
Optional but useful before you mutate alerting: fetch connection details so shipper jobs and alert jobs share the same stack identity.
curl -H "x-api-key: $LOGIT_DASHBOARD_API_KEY" \
  https://dashboard.logit.io/api/stacks/$LOGS_ID/connection-details
The schema returns stackType and services[], each with a serviceName and details[] of name/value pairs (Logstash endpoints, OpenSearch URLs, and related service info). Use that to confirm you are staring at the stack you think you are. Overview and getting-started endpoints on the same /api/stacks/{stackId} path are good health checks when a brand-new stack still looks empty.
Enable alerting, then POST the rule
Alert rule endpoints live under the stack. Walk the sequence from Alerting via API.
Enable alerting for the Logs stack (provisions the alerting server if needed):
curl -X POST -H "x-api-key: $LOGIT_DASHBOARD_API_KEY" \
  https://dashboard.logit.io/api/stacks/$LOGS_ID/alerting/enable
The enable response includes alreadyStarted (boolean) and may include averageDuration. Idempotent re-runs in CI are fine when the server is already up. Confirm with status:
curl -H "x-api-key: $LOGIT_DASHBOARD_API_KEY" \
  https://dashboard.logit.io/api/stacks/$LOGS_ID/alerting/status
Status returns a status string. If enable fails with 403, the key's user likely lacks permission on that account or stack — fix access in the dashboard rather than retrying the same POST.
List templates, then create a rule. Global templates:
curl -H "x-api-key: $LOGIT_DASHBOARD_API_KEY" \
  https://dashboard.logit.io/api/alert-rule-templates
Create from a template. The request body is CreateAlertRuleRequest: required newFileName, optional templateFileName, optional source.
curl -X POST -H "x-api-key: $LOGIT_DASHBOARD_API_KEY" \
  -H "Content-Type: application/json" \
  -d '{"newFileName": "ci-deploy-freq.yaml", "templateFileName": "frequency"}' \
  https://dashboard.logit.io/api/stacks/$LOGS_ID/alerting/rules
newFileName is the rule file name you will see in the list (use a .yaml name your team recognizes). templateFileName seeds the rule from a built-in template such as frequency; omit it only when you intend to start empty and draft YAML yourself. The response includes ruleId — keep that ID for get/status/test steps.
Field walk after create:
GET .../alerting/rules— list withruleId,fileName,isLive,hasDraftYaml.GET .../alerting/rules/$RULE_ID—fileName,configuration(YAML string),isLive,hasDraftYaml, timestamps.GET .../alerting/rules/$RULE_ID/status— rulestatusplus staleness metadata.POST .../alerting/rules/$RULE_ID/test— run a test against the rule before you trust it in production traffic.
When CI already owns full ElastAlert YAML, use POST .../alerting/rules/from-configuration with required newFileName and configurationYaml instead of a template seed. That path is for checked-in YAML; the template path above is the shorter first CI proof.
When the job returns 401 or hits the wrong stack
401 on /api/me/profile means the secret never authenticated. Re-copy the key from Profile, confirm the Actions secret name matches the env var, and strip trailing newlines that some secret UIs append.
403 after a working profile call usually means the authenticated user cannot mutate that stack's alerting. Check account membership and stack permissions in the dashboard. Creating a second personal key does not grant new roles.
Wrong $LOGS_ID is quieter. Enable and create can succeed on a sibling stack while the dashboard tab you are watching stays unchanged. Always print the stack ID and product name from /api/account/$ACCOUNT_ID/stacks in the job log (never the API key). Calling Metrics endpoints with a Logs ID — or the reverse — breaks paths that expect @metrics_id vs @logs_id.
Host mistakes show up as connection errors, not JSON bodies: the base host is dashboard.logit.io, not an OpenSearch -es.logit.io hostname and not a regional marketing URL. Sending Authorization: Bearer instead of x-api-key fails auth even when the key string is valid. Missing Content-Type: application/json on the create POST can reject a body that looks fine in a local shell with different defaults.
If create returns a rule ID but the UI list looks empty, refresh the alerting rules list via GET .../alerting/rules and match on fileName. Draft-only rules show hasDraftYaml true and isLive false until you apply/test through the documented rule lifecycle.
Put the calls in GitHub Actions
Once curl works locally with the same secret, move the sequence into a workflow that runs when alert config changes — for example on pushes to alerting/**.yaml. Steps: checkout → install jq → resolve ACCOUNT_ID / LOGS_ID from the accounts and stacks endpoints → POST enable → POST create (or from-configuration with the committed YAML) → echo ruleId → optional test POST. Keep LOGIT_DASHBOARD_API_KEY in repository or environment secrets.
Next automation after that first rule ID lands: maintain draft YAML in git, push updates through the rule draft/apply endpoints documented on the same alerting page, and generate a typed client from the OpenAPI schema at https://dashboard.logit.io/api/reference/v1/logit-api-schema.json (see API Reference and Generating Clients). Metrics stacks follow a parallel path with AlertManager and metrics-rules under @metrics_id — switch IDs deliberately when you expand beyond Logs.
Cross-check every path against the live docs before you merge the workflow. Stack IDs are account-specific. Keys revoke immediately. The control-plane win is a job log that prints a real ruleId for the stack you meant to change.