
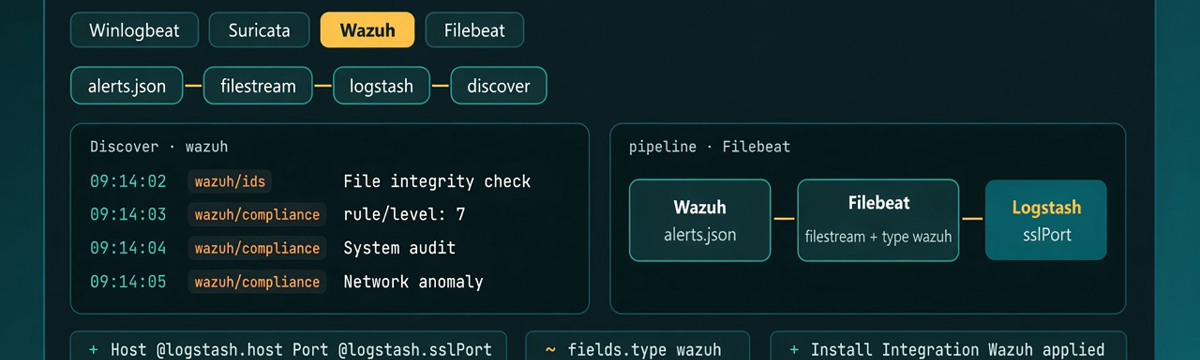

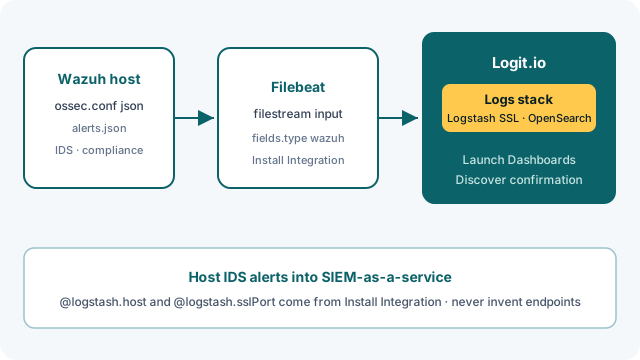
Wazuh writes host IDS and compliance alerts. On Logit.io the first useful path is Filebeat reading /var/ossec/logs/alerts/alerts.json into a Logs stack over Logstash SSL, then finding those documents in OpenSearch Dashboards Discover. That is a SIEM-as-a-service ingest step, not an app-log Filebeat tutorial and not a Windows Event Log journey.
Contents
Host IDS alerts into SIEM as a Service
Generic Filebeat posts point at /var/log/*.log and call it security monitoring. Winlogbeat covers Windows Event Log channels. Fluent Bit covers lightweight app and container lines over HTTP. Wazuh is the host sensor: integrity checks, rule hits, compliance alerts. Logit's documented path keeps Wazuh as that sensor and uses Filebeat only as the shipper into managed OpenSearch. See SIEM as a Service for how Wazuh sits beside Winlogbeat and Suricata as a security source.
Classic OSSEC has a separate Filebeat page. If you run Wazuh, follow Wazuh configuration rather than pasting OSSEC or generic Filebeat snippets.
Make Wazuh write alerts.json
Sign in at the Logit.io dashboard and create a Log Management stack. Managed Logstash, OpenSearch, and Dashboards come with it. Log Management getting started covers the stack; Account and stack covers account setup if the dashboard is new.
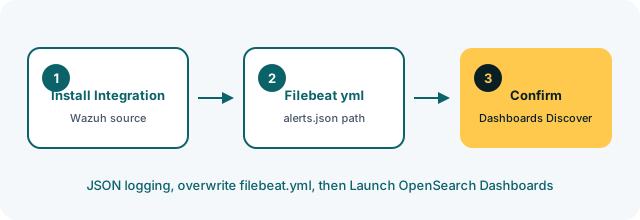
From the stack overview, open Install Integration and choose Wazuh. That binds @logstash.host and @logstash.sslPort to this stack. Endpoints from a Fluent Bit trial or a generic Filebeat ticket will not work here.
Before Filebeat starts, force JSON logging on the Wazuh manager. In /var/ossec/etc/ossec.conf the docs require:
<logging>
  <log_format>json</log_format>
</logging>
Restart with sudo systemctl restart wazuh-manager. On the manager host, confirm /var/ossec/logs/alerts/alerts.json exists and grows when Wazuh raises an alert. Tail it briefly if you need proof before touching Filebeat. If the manager still writes only plain-text alert logs, Filebeat will sit on an empty or wrong path and Discover will stay quiet no matter how clean your YAML looks.
Install Integration still matters even after JSON logging works. The Filebeat template's Logstash host and SSL port come from that button for this stack. Skipping it and pasting last week's endpoints is the fastest way to debug the wrong destination.
Walk the Logit Filebeat yml
Install Filebeat on a host that can read the alerts file (the Wazuh docs include Windows and Linux install paths). Overwrite the Filebeat config, typically /etc/filebeat/filebeat.yml, with the Logit template from Install Integration. The live sample on Wazuh is:
filebeat.inputs:
- type: filestream
  enabled: true
  paths:
  - "/var/ossec/logs/alerts/alerts.json"

  fields:
    type: "wazuh"
  fields_under_root: true
  encoding: utf-8
  ignore_older: 12h

output.logstash:
  hosts: ["@logstash.host:@logstash.sslPort"]
  loadbalance: true
  ssl.enabled: true
type: filestream is the input. enabled: true keeps it active. paths must be the JSON alerts file, not /var/log/syslog, not alerts.log, and not a wildcard over every OSSEC log. fields.type: "wazuh" with fields_under_root: true stamps a top-level type field you can filter in Discover. encoding: utf-8 matches the JSON file. ignore_older: 12h skips stale file content older than twelve hours so a first start does not replay ancient alerts unless you want that.
On the output side, hosts must use the Install Integration values for @logstash.host and @logstash.sslPort in the documented "@logstash.host:@logstash.sslPort" form. loadbalance: true is part of the documented template. ssl.enabled: true is required for Logit Logstash SSL; leaving SSL disabled is a common reason a “running” Filebeat never appears in Discover.
Do not leave a second filestream input in the same yml that still harvests /var/log/syslog or a generic app path from an earlier Filebeat experiment. The Wazuh proof is the alerts.json input with type: "wazuh". Extra inputs muddy Discover and make it look like the SIEM path failed when you are really staring at the wrong documents.
Validate the YAML with the Filebeat test command on the same docs page, then start the service (PowerShell Start-Service filebeat on Windows, or the platform-specific start steps on the docs tabs). If the test command prints that no outputs are defined, the output.logstash block did not load. Fix that before you chase Wazuh.
Unlock complete visibility with hosted ELK, Grafana, and Prometheus-backed Observability
Filter type:wazuh in Discover
Back on the stack, click Launch OpenSearch Dashboards. Open Discover and select the index pattern this Log Management stack created. A leftover Filebeat pattern from another trial will not show the Wazuh stream.
Set the time picker to Last 15 minutes, the troubleshooting window called out in Getting started with OpenSearch Dashboards. Trigger a Wazuh alert on the host (or wait for a routine integrity or rule hit), then refresh Discover.
Search for type:wazuh. That field is what the Filebeat template stamps via fields.type with fields_under_root: true on the live docs sample. It is the reliable filter for this integration because it comes from the config Logit publishes, not from a guessed alert schema.
Expand a matching document and confirm the payload is Wazuh alert JSON from alerts.json, not a syslog line Filebeat picked up from the wrong path. If you see host logs without type:wazuh, your filestream path or fields block is wrong even if something is arriving. The OpenSearch Dashboards overview covers the UI. Documents with type:wazuh in that time window mean the Logstash SSL leg is working.
When Filebeat runs but alerts never land
Re-copy @logstash.host and @logstash.sslPort from Install Integration first. Wrong host or SSL port is still the dominant miss. Confirm ssl.enabled: true stayed in the output block.
On the host, check that Wazuh is actually appending to /var/ossec/logs/alerts/alerts.json after the manager restart. If JSON logging was skipped, Filebeat may be watching a file that never updates. If paths still points at syslog or a plain-text alerts log, Discover may fill with the wrong shape of events, or with nothing useful for a Wazuh proof. Compare the running filebeat.yml to the docs template character for character on the paths and fields lines before you open a support ticket.
ignore_older: 12h can hide older alerts after a quiet period. Generate a fresh alert, keep Last 15 minutes selected, and confirm the JSON file's modification time moved. Outbound TLS blocked to the Logstash SSL port looks like a healthy Filebeat service with an empty Discover view. ssl.enabled: false (or a missing SSL block) fails the same way from Discover's point of view.
If the stack stays empty after a clean yml and a growing alerts.json, follow How can I diagnose no data appearing.
Classify threats on the Wazuh stream
Once Discover shows type:wazuh documents from this host, stop adding shippers. The next useful step on Logit is enrichment on the stack you already proved: open Logstash Pipelines, add a threats_classifier block in the filter section as shown in the threats classifier docs, save, and restart the pipeline if prompted. Re-check a fresh type:wazuh document in Discover for the classifier fields before you write alert rules on top of raw alerts.
After enrichment looks right, wire managed Alerting to a destination from the destinations list. Both steps assume the Filebeat to Logstash SSL path for alerts.json is already reliable.
Cross-check every snippet against Wazuh configuration before you paste. Hostnames, SSL ports, and credentials are stack-specific, and they change when you rebuild the stack.