
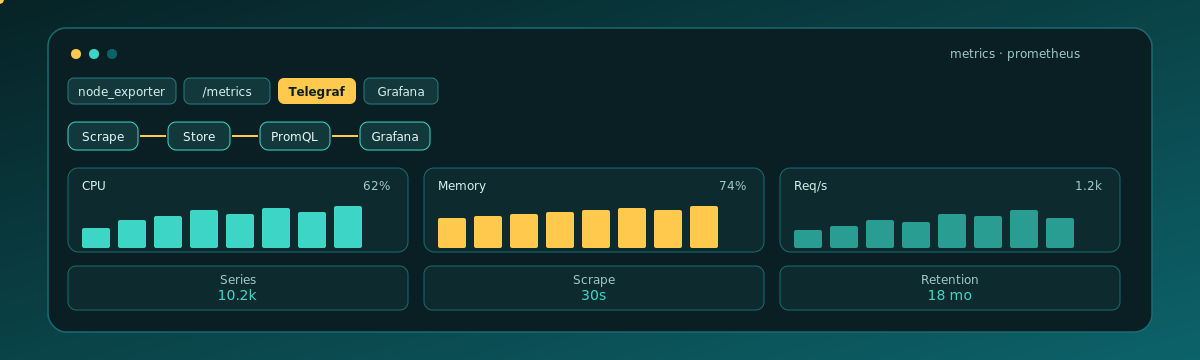

Logs tell you something broke. A graph tells you when it started drifting. On Logit.io that second view is an Infrastructure Metrics stack: Telegraf scrapes a Prometheus /metrics endpoint, the stack stores the series, and Launch Metrics opens hosted Grafana so you can see them in Explore.
Contents
Make the Metrics stack
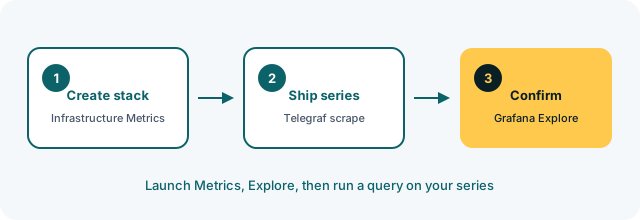
Sign in at the Logit.io dashboard and create an Infrastructure Metrics stack. That gives you the ingestion endpoint, retention, and Grafana in one place. The Infrastructure Metrics docs and the metrics getting-started page cover what the stack actually is. Account and stack is the account-level walkthrough if the dashboard is new to you.
From the stack overview, open Install Integration (or the metrics credentials panel) and copy the values shown for this stack. Hostnames and passwords are per-stack. Pasting ones from a screenshot in Slack will fail quietly.
Scrape with Telegraf
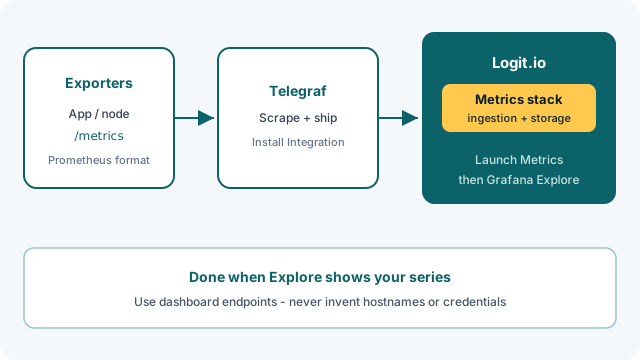
The path Logit documents for Prometheus is Telegraf scraping /metrics and forwarding into the Metrics stack. Follow Prometheus integration: pick the source in Install Integration, install Telegraf for the OS, apply the config from that page. Keep the first scrape tiny. One node_exporter or one app you can restart is enough.
Install Integration prints the Telegraf output block for the stack: endpoint, user, password. Leave those as-is. The only thing you should change on a first pass is the scrape target, so it points at an exporter you can hit from that host. If Telegraf starts and the target refuses the scrape, Explore will stay empty even though the agent looks healthy.
On Linux the docs have you drop the file under the Telegraf conf directory and restart the service. On Windows it is the same config, different service name. telegraf --test (or the check command on the docs page) is worth running before you decide Logit is the problem.
If Telegraf is already running elsewhere, start from Getting started with Telegraf and the Telegraf configuration guide, then point a prometheus input at your target plus the Logit output from the dashboard. Remote write is a different ingestion path. Use the live remote write docs if that is what you actually run.
Validate the config, start the agent, wait one scrape interval. You are proving the pipe, not cataloguing every job in production.
Unlock complete visibility with hosted ELK, Grafana, and Prometheus-backed Observability
Open Grafana Explore
In the dashboard, open the Metrics stack and click Launch Metrics. That is hosted Grafana for the stack. Explore sits in the left sidebar. Pick the metrics data source, set the time range to the last 15 minutes, and query something you know the scrape exposes. node_cpu_seconds_total if you used node_exporter. Otherwise whatever the app actually publishes.
The click-path is in View infrastructure metrics with Grafana. Getting started with Grafana Dashboards is the wider Grafana intro. A line in Explore is the whole point of this session.
Counters need a function. Raw node_cpu_seconds_total is a line that only goes up. rate(node_cpu_seconds_total[5m]) is what you actually want to look at. If you have never used PromQL, Grafana’s metric picker still lists what arrived, which is enough to prove ingestion.
When Explore is empty
Usually the scrape URL is wrong, Telegraf is not running, or the time picker is tighter than the first interval. Compare the dashboard credentials to the config you saved, check the agent is up, then widen the range and wait. Install Integration keeps host and port tied to the stack you are looking at, which is why it beats copying from an old ticket.
If Telegraf is on a different machine than the exporter, localhost:9100 is the wrong scrape target. Point it at an address that host can actually reach. Grafana Explore also has to use the data source for this Metrics stack, not an old Prometheus you added by hand. Launch Metrics from the dashboard so you land in the right Grafana org.
The stack overview shows scrape-related settings and how long series are kept. A 30 second scrape plus a 15 minute window is plenty for a first line. If you just started the agent, wait two intervals before you decide nothing arrived.
Leave the other jobs
Do not add every cluster and custom exporter today. One scrape you control is the proof. After Explore is honest, add a panel. A CPU alert from Configure CPU alerts can come later if you want noise on a threshold. The metrics alerting overview can wait until the series exist.