
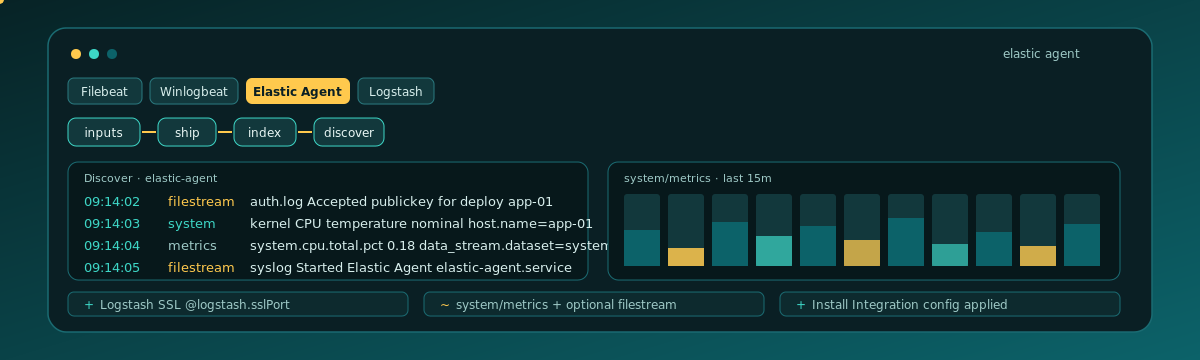

Filebeat tails files. Winlogbeat reads the Windows Event Log. Elastic Agent is Elastic's unified binary: one service can carry system metrics and log inputs without standing up a Beat per data type. On Logit.io the onboarding path runs through Install Integration, a stack-specific elastic-agent.yml, Logstash over SSL, and confirmation in OpenSearch Dashboards Discover.
Contents
Why one Elastic Agent
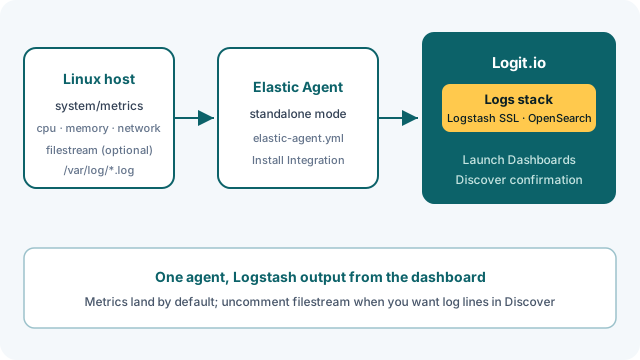
If you already proved Filebeat on a Linux box, you know the pattern: one shipper, one log path, Discover rows. Elastic Agent is the next step when you want Fleet-style inputs in a single process. CPU and memory metrics can ride alongside a filestream for /var/log without installing Metricbeat beside Filebeat.
That is different from Winlogbeat on Windows, where Event Log channels are the whole story. Elastic Agent on Linux is often metrics-first: the Logit sample config ships a system/metrics input out of the box. Uncomment the filestream block when you want log lines in Discover on the same host. The live guide is Elastic Agent configuration.
Install Integration on the stack
Sign in at the Logit.io dashboard and create a Log Management stack. That gives you managed Logstash, OpenSearch, and Dashboards. Log Management getting started walks the stack shape; Account and stack covers account setup if the dashboard is new.
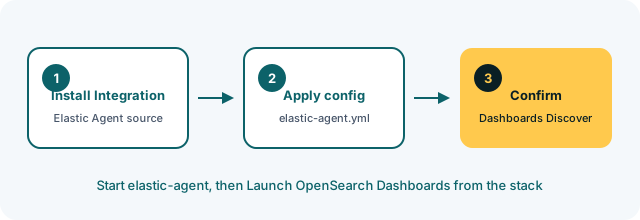
From the stack overview, open Install Integration and choose Elastic Agent. Click the button on the docs page if you landed there first. That ties the Logstash host, SSL port, and sample YAML to this stack. Endpoints from another team's Filebeat ticket will not work here.
Merge elastic-agent.yml
Install Elastic Agent in standalone mode using Elastic's guide: Install standalone Elastic Agent. You need root on the host and the Logstash SSL port open. The docs page calls out verifying @logstash.sslPort before you start shipping.
Copy the configuration from Install Integration (or the YAML block on the same Elastic Agent page) and overwrite elastic-agent.yml. Do not paste a config from a blog or chat. The Logit block is already wired for Logstash output with SSL: hosts: ["@logstash.host:@logstash.sslPort"] with the dashboard placeholders replaced by your stack values.
The sample enables system/metrics with cpu, memory, network, and filesystem metricsets. That is enough to prove the agent is talking to Logstash even before you turn on logs. The filestream example for /var/log/*.log stays commented in the docs YAML. Leave it that way for a metrics-only first pass, or uncomment it if Discover rows are your done state today.
Full input options live under Elastic Agent Inputs (Optional) on the docs page. Defer audit, process, and network inputs until the default block is healthy.
Unlock complete visibility with hosted ELK, Grafana, and Prometheus-backed Observability
Start the agent, open Dashboards
Start or restart elastic-agent after you save the config. Elastic documents the service commands on the standalone install page linked above. Give it a minute after the restart before you decide nothing arrived.
Back on the stack, use Launch OpenSearch Dashboards (the docs section is Launch Logit.io to view your logs). In Discover, widen the time range and filter on the host you just enrolled. If filestream is still commented out, look for system.cpu or system.memory documents first. Those metricsets confirm ingestion even when no log files are wired yet.
Getting started with OpenSearch Dashboards and the OpenSearch Dashboards overview cover the UI. Rows tied to your host name mean the Logstash leg is working.
Agent up, Discover quiet
Wrong Logstash hostname or SSL port is the usual miss. Re-copy the Install Integration block and confirm the port is reachable from the host. Firewall rules that block outbound TLS to the stack look like a healthy local agent with an empty Discover view.
Discover also has to use the index pattern this stack created. An old Filebeat pattern from another trial will not show Elastic Agent fields. Search for data_stream.dataset or agent.type to confirm you are in the right stream.
If the stack stays empty after a clean config, follow How can I diagnose no data appearing on the docs site. That is the same path linked from the Elastic Agent page under diagnosing no data in the stack.
Enable filestream second
Metrics-only is a valid first win. Once cpu and memory documents show up, uncomment the filestream stanza on the docs page, point paths at a log directory you control, restart the agent, and watch Discover for new lines. Filebeat is still the right single-purpose choice when logs are the only goal and you do not need unified inputs. Elastic Agent earns its install when you plan to add inputs on the same host without a second Beat service.
Cross-check every snippet against Elastic Agent configuration before you paste. Hostnames, SSL ports, and credentials are stack-specific, and they rotate when you rebuild the stack.