
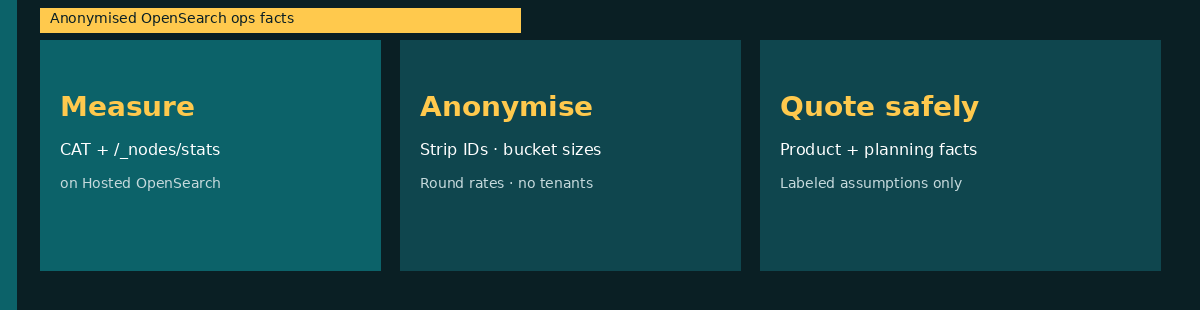

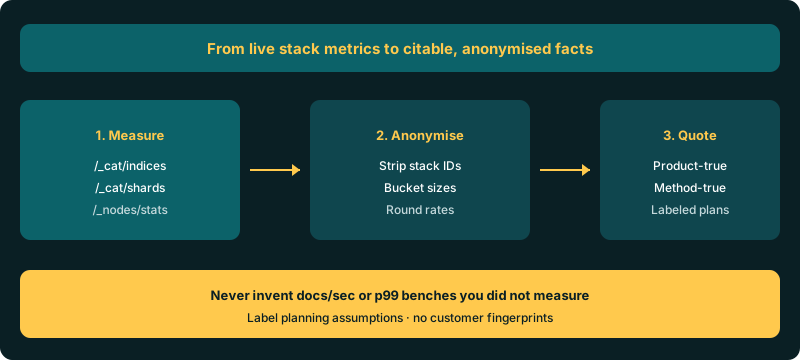
Generic OpenSearch explainers recycle shard vocabulary and “tune your cluster” slogans. Buyers and practitioners need something tighter: facts you can cite because you measured them on a real stack, then scrubbed anything that identifies a tenant. On Hosted OpenSearch that measurement surface is already there — CAT APIs, cluster health, and /_nodes/stats through the documented REST host — without asking anyone to publish raw index names or stack IDs.
This post is the research method for engineering-moat writing: how to pull operational signals, anonymise them safely, and keep a short appendix of quotable facts that stay product-true or clearly labeled as planning assumptions. Sister methodology posts already cover the levers you will interpret — shard sizing with CAT APIs, 50 GB / 250 GB / 1 TB per day planning scenarios, and production high-ingestion settings. No invented docs/sec. No fake customer names. No unlabeled “we saw p99 at X” claims.
Contents
Why anonymised ops facts beat generic OpenSearch explainers
A commodity “what is OpenSearch” page cannot help a capacity review or a pricing conversation. An anonymised ops fact can: it states what was measured, how it was scrubbed, and what class of claim it supports. That is the difference between SEO filler and engineering-moat content buyers can trust.
Three claim classes are worth publishing:
- Product-true — Hosted OpenSearch behaviour and published pricing that anyone can verify on Logit.io docs and public tables (for example developer tiers from $45.52/node/mo annual on OpenSearch pricing).
- Methodology-true — the exact CAT or stats call, the field you read (
pri.store.size, replica placement, indexing pressure), and the anonymisation rule you applied. - Planning assumptions — scenario tables (daily volume bands, starting shard/refresh levers) labeled as assumptions, never as lab benchmarks.
If a sentence cannot land in one of those three buckets, do not publish it as a “fact.”
What you can safely measure on Hosted OpenSearch
Start from a live stack. Create one with create an OpenSearch cluster, copy the REST host from Stack Settings → Endpoints, and authenticate as in connect to your cluster. Calls go through the host in the OpenSearch REST API guide.
Useful measurement surface (add ?v for headers where supported):
GET /_cat/indices?v&h=index,health,pri,rep,docs.count,store.size,pri.store.size
GET /_cat/shards/{index}?v
GET /_cluster/health?pretty
GET /_nodes/stats/indices/indexing,indices/search,os,jvm?pretty
pri.store.size day-over-day on the write index is the primary-byte growth signal used in capacity planning. /_cat/shards proves whether replicas actually allocate. /_nodes/stats surfaces indexing pressure, JVM, and OS signals when bulk slows — trends on your workload, not a vendor scoreboard. Cluster and CAT behaviour lives under Cluster & CAT APIs; bulk ceilings under Document APIs and managed stack limitations.
Capture a baseline before any template or replica change, then again after the next rollover. Dev Tools in OpenSearch Dashboards uses the same Endpoints credentials as curl.
Anonymisation rules before you publish
Raw CAT output is operationally useful and commercially dangerous. Treat every export as sensitive until scrubbed:
- Strip identifiers — replace stack names, tenant IDs, endpoint hostnames, index prefixes that encode a customer or internal project, and node names that fingerprint a fleet. Prefer placeholders like
write-index-*orstack-N. - Bucket sizes — publish ranges, not exact byte counts that could reverse-identify a workload. Example: “primary store in the tens of GB” or “~50 GB / day planning band,” not
47.3GBon a named index. - Round rates — if you ever quote indexing or search rates from
/_nodes/stats, round aggressively and state the window. Prefer qualitative pressure (“rising indexing pressure after bulk batch increase”) over precise docs/sec you did not validate as a controlled bench. - Separate claim labels — mark each published sentence as product, method, or planning assumption. Never mix a public price with an unlabeled “typical throughput.”
- No customer theatre — do not invent company names, logos, or “a Fortune 500 saw…” framing. Anonymised does not mean fictional.
Keep the scrubbed snapshot next to the private raw capture in your notes. Reviewers should be able to re-run the method on their own Hosted OpenSearch stack and get the same class of signal — not your tenant’s fingerprint.
Unlock complete visibility with hosted ELK, Grafana, and Prometheus-backed Observability
Quotable appendix: planning and product facts
Use the lines below as citation-ready starters. Each carries an explicit label.
Product-true facts
- Product: Logit.io Hosted OpenSearch is a managed multi-node OpenSearch product; create flow and Endpoints are documented in the OpenSearch overview and Hosted OpenSearch overview.
- Product: Published OpenSearch developer tiers start from $45.52/node/mo annual on OpenSearch pricing.
- Product: Public log management plans start from $25/mo, metrics from $12/mo, and APM from $20/mo (annual tables). Shipper-first pipelines stay on log management unless OpenSearch itself is the workload.
- Product: Measurement and admin REST calls use the stack host documented under the OpenSearch REST API and Cluster & CAT APIs guides.
Methodology-true facts
- Method: Primary footprint for sizing starts from
pri.store.sizeon/_cat/indices; approximate per-primary size aspri.store.size / priwhen needed. - Method: Replica placement is verified with
/_cat/shards; yellow after a replica bump is often settings math until proven otherwise. - Method: Ingest pressure during bulk windows is inspected via
/_nodes/stats(indexing, JVM, OS) as trends — not a one-shot scoreboard.
Planning assumptions (not lab benches)
- Planning assumption: A common working band is to grow past roughly ~10GB per primary before celebrating “more shards”; stop chasing larger targets when recovery or relocation dominates the maintenance window (see shard sizing guide).
- Planning assumption: Capacity conversations can be framed as ~50 GB, ~250 GB, and ~1 TB primary bytes per day scenarios — labeled assumptions with shipper/refresh/replica levers, not measured throughput claims (see ingestion capacity guide).
- Planning assumption: During sustained write windows, widening
refresh_intervaland keeping bulk batches inside documented Document API ranges is a safer first move than multiplying primaries mid-incident (see high-ingestion settings).
Windows shipper choice changes arrival shape, not the anonymisation rules — see five ways Windows Event Logs reach OpenSearch and the Winlogbeat 8 → 9 canary when the fleet is the variable.
Failure modes: over-claiming, fingerprints, invented benches
- Invented throughput — docs/sec, GB/s, or p99 latency presented as Logit lab results without a measured run. Delete the number; keep the method.
- Unlabeled planning tables — scenario rows that read like case studies. Always say “planning assumption.”
- Identifying fingerprints — real index names, stack IDs, or exact sizes that only one customer would match. Bucket and placeholder.
- Yellow misread as platform outage — publishing “Hosted OpenSearch went yellow” when replica count exceeds placeable nodes. Measure allocation first.
- Shipper version as shard policy — blaming Winlogbeat major version for primary-byte math. Size from CAT; migrate shippers separately.
Get started
Open Endpoints on your Hosted OpenSearch stack, run the CAT and /_nodes/stats calls above, and store a private baseline. Scrub identifiers, bucket sizes, and round any rates before anything leaves your notes. Cite only product-true prices, methodology steps, or labeled planning assumptions from the appendix. Ground the product in the Hosted OpenSearch overview and OpenSearch pricing; continue with shard sizing, ingestion capacity planning, and high-ingestion settings when you need the knob-by-knob path.
Measure. Scrub. Quote only what you can defend.