
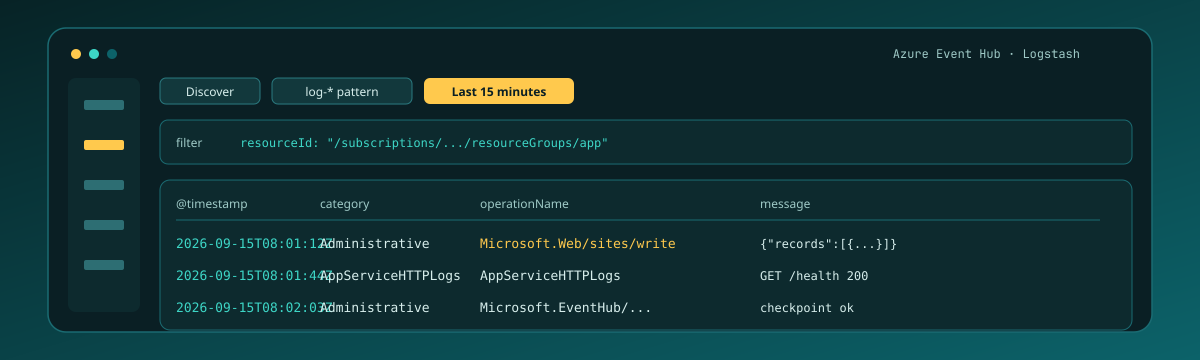

Azure Monitor already owns the platform and diagnostic lines. The first useful win on Logit.io is not a fleet of agents on every VM. It is one Event Hub, a dedicated Logstash consumer group, the azure_event_hub input on a Logs stack (Logstash 6.4+), and rows in OpenSearch Dashboards Discover that show message plus Azure identifiers such as resourceId. If you are still proving that a Logs stack can accept anything at all, start with First Logs on Logit.io. The AWS twin on this journey is First CloudWatch Logs on Logit.io — Lambda shipper there, Event Hub consumer here.
Contents
Event Hub, not every VM
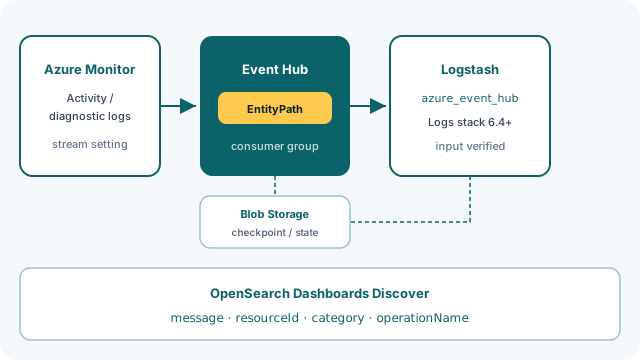
Getting started if you're running in Azure splits the world cleanly. AKS nodes and Linux or Windows VMs that already write app logs on disk should ship those files with the direct agent paths (Winlogbeat, Filebeat, Fluent Bit, and friends). Platform and diagnostic traffic is different. Activity logs, resource diagnostic settings, and Azure Monitor exports land in Event Hub first; Logstash then pulls them into the stack. That is the path documented under Azure Logs, and it is the one this post walks end to end.
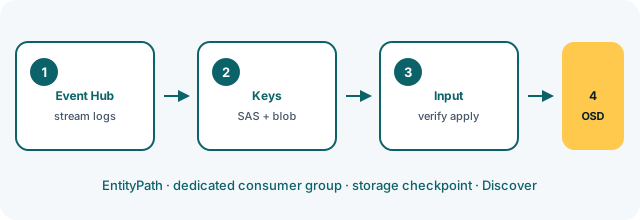
Skip the temptation to bolt an agent onto every App Service plan or PaaS resource just to prove ingestion. Event Hub is the queue. Logstash is the consumer. Discover is the proof.
Stream Monitor logs into one hub
In the Azure Portal, create or reuse an Event Hubs namespace and a single hub for the first proof. Then point Azure Monitor at that hub. Microsoft's stream guide — linked from the Logit Azure docs — covers streaming monitoring data to Event Hubs. For subscription-level activity only, the sibling integration Azure Activity Logs expects a diagnostic setting that forwards the Activity Log into the same hub shape.
Before you touch Logit, open the hub's metrics chart in the Portal. Incoming requests must move. The Activity Logs docs are blunt: if that graph sits at zero, Logstash has nothing to pull and Discover will stay empty no matter how perfect the connection string looks.
One hub for the first proof. One diagnostic category or Activity Log stream you can recognize later in category or operationName. You can fan in more hubs after this path is boring.
Consumer group and the connection string
Create a Consumer Group specifically for Logstash. Do not reuse $Default. The Azure Logs and Activity Logs docs both say this — shared default groups fight other readers for the same partitions and leave you staring at lag that is not yours.
Then open the hub's Shared access policies and copy a connection string that includes an EntityPath. The documented shape is:
Endpoint=sb://<youreventhubnamespace>.servicebus.windows.net/;SharedAccessKeyName=<yoursharedaccesspolicyname>;SharedAccessKey=<yoursharedaccesskey>;EntityPath=<youreventhubname>
Walk the pieces. Endpoint is the namespace. SharedAccessKeyName and SharedAccessKey are the policy credentials. EntityPath must match the hub that is actually receiving the Monitor stream — a namespace-level string without EntityPath, or a path pointing at a different hub, is a classic silent miss. Treat that whole string as a secret; paste it into the Logit input form, not into a public ticket.
Blob storage keeps the checkpoint
The Logstash Azure Event Hub input stores consumer state in a Blob Storage account so offsets survive reboots. In the Portal, open a storage account's Access Keys and copy the connection string. The docs show the shape:
DefaultEndpointsProtocol=https;AccountName=<storage-account-name>;AccountKey=<storage-account-key>;EndpointSuffix=core.windows.net
Without that storage connection, every Logstash restart can re-read from the configured initial position instead of resuming. On a busy hub that looks like duplicate floods or a mysterious gap after a stack apply. Dedicated consumer group plus blob checkpoint is the pair that makes the pull reliable.
Unlock complete visibility with hosted ELK, Grafana, and Prometheus-backed Observability
Install Integration, then azure_event_hub input
Open a Log Management stack. On the Azure Logs docs page (or from the stack), click Install Integration for the Azure source. That binds the placeholders to this stack.
Configure an Azure Event Hub Logstash input with the Event Hub connection string, the dedicated consumer group name, and the storage account connection string. The plugin is available on stacks running Logstash 6.4 onwards — older Logstash builds simply do not offer this input. Logit verifies the input before it is applied and confirms when that check finishes. Do not assume the pull is live the second you hit save; wait for verification.
You are not POSTing to the Stack API the way the CloudWatch Lambda shipper does. This path is Logstash as a long-running consumer of Event Hub partitions. Wrong stack, wrong Logstash version, or an input still pending verification all look the same from Discover: silence.
Prove resourceId in Discover
On the stack, Launch OpenSearch Dashboards. Open Discover and select the index pattern this Log Management stack created. Set the time picker to Last 15 minutes.
The azure_event_hub input lands each Event Hub payload in message — usually a JSON blob Azure Monitor exported, often with a nested records array. After the stack's common filters parse that JSON (and split records when present), look for the Azure Monitor identifiers the export actually carries:
message— raw or partially parsed payload from the hubresourceId— the Azure resource ARM path for that recordcategory— for example an Activity Log category or a diagnostic category nameoperationName— the operation string on administrative or control-plane events@timestamp— once the pipeline maps the record time into Logstash's timestamp
Filter on a resourceId fragment you recognize from the Portal, or free-text search a distinctive operationName. Rows with those fields mean Event Hub had traffic, the consumer group advanced, and OpenSearch indexed the events. Do not invent CloudWatch-style logGroupName here — that field belongs to the AWS Lambda shipper path, not this input.
Once Discover is reliable, a narrow alert on the same operationName or error pattern is the usual next step on the journey — see Your First Useful Log Alert on Logit.io. Wire alerting after the hub-to-Discover hop is dull.
Hub quiet, Discover quiet
Start in Azure when Discover is empty. Zero incoming requests on the Event Hub chart means the diagnostic setting never reached this hub — fix the stream before you rewrite Logstash. Wrong EntityPath points Logstash at a hub that never saw the Monitor export. Reusing $Default (or another team's group) produces lag and partial reads that look like random gaps.
Missing blob storage connection strings drop checkpoints across reboots; after a stack restart you may re-consume old offsets or skip forward depending on initial position. Logstash below 6.4 will not offer the Azure Event Hub input at all. An input still pending Logit verification is not applied yet — wait for the confirmation, or check the stack settings for a failed verify.
If the hub graph moves, the consumer group is dedicated, and verification succeeded, but Discover stays empty, follow How can I diagnose no data appearing — the same diagnosis path the Azure integrations link. Confirm the time picker covers the pull window and that you are on the Logs stack that received Install Integration, not a Metrics stack Grafana.
Stop there for logs. Azure Metrics via Event Hub is a separate integration — see Azure Metrics when you want numeric series, not Discover documents. Cross-check connection strings and consumer group names against the live docs before you paste; Shared Access Keys rotate, and EntityPath typos waste an afternoon.