


Windows Event Log is not a folder of files. Application, System, and Security live in the Event Log service, and the shipper you pick has to read those channels with the right privileges before anything useful shows up in OpenSearch Discover. This post is the production path map for getting those events into Hosted OpenSearch on Logit.io — five concrete pipes, each with a minimal config, the dashboard fields you must copy, and the failure modes that waste a day.
It is not a first-host walkthrough. That journey is First Windows Event Logs with Winlogbeat on Logit.io. Here the question is which shipper fits the fleet you already run, and how each one maps onto Logit’s Install Integration endpoints (or the OpenSearch -es host) without inventing GB/s charts. Log Management plans start from $25/mo annual; dedicated OpenSearch nodes from $45.52/node/mo annual on the published developer table — see OpenSearch pricing.
Contents
Copy endpoints from the right stack
Every path below dies the same way if you paste last week’s Linux Filebeat host into a Windows config. On a Log Management stack, open Install Integration, pick the shipper, and take the printed Logstash host and SSL port. On a dedicated OpenSearch stack, Stack Settings → Endpoints gives https://{stack-id}-es.logit.io plus credentials — same place the cluster settings docs describe.
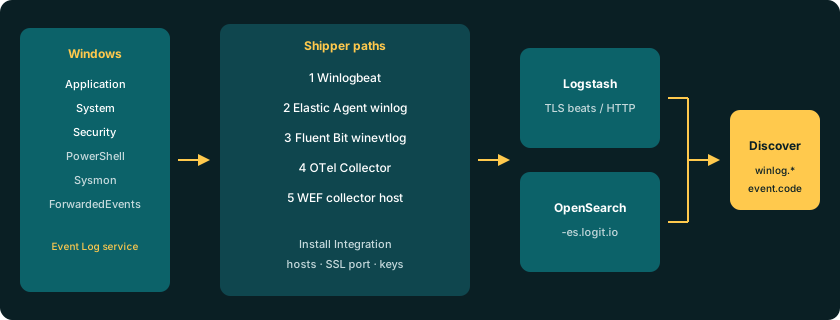
Prove Application, System, and Security first. Sysmon, PowerShell operational, and ForwardedEvents wait until those three channels land. Wrong channel spelling returns an empty Discover with a “healthy” service — not an HTTP error.
Path 1: Winlogbeat → Logstash SSL
Default Windows path on Logit.io. Follow Winlogbeat configuration (or the combined Windows Winlogbeat and Telegraf page). Install the Windows service as Administrator, replace winlogbeat.yml with the Install Integration block, keep hosts and SSL exactly as printed:
winlogbeat.event_logs:
  - name: Application
    ignore_older: 72h
  - name: System
  - name: Security

fields:
  type: wineventlog
fields_under_root: true

output.logstash:
  hosts: ["@logstash.host:@logstash.sslPort"]
  loadbalance: true
  ssl.enabled: true
  pipeline: "winlogbeat-%{[agent.version]}-routing"
Required fields: channel name list, output.logstash.hosts, ssl.enabled: true, and the routing pipeline string from the dashboard sample. Credentials are implicit in the TLS beats session to Logstash — do not invent an Elasticsearch username in this path.
In Discover expect type: wineventlog, winlog.channel, event.code, host.name, and message/provider fields from the Winlogbeat schema. Failure modes: service installed but PowerShell execution policy blocked the install script; Security channel empty because local audit policy never enabled logon events; ignore_older so tight you only see Application while debugging “no data.”
Path 2: Elastic Agent with a winlog input
Elastic Agent on Logit.io ships a Logstash output already pointed at your stack. The Install Integration sample leads with system/metrics and an optional filestream — useful, but Event Log is a winlog input, not a file path. Keep Logit’s output block; add a Windows Event Log input on the agent host:
inputs:
  - type: winlog
    id: windows-event-logs
    data_stream.namespace: default
    use_output: default
    streams:
      - name: Application
        data_stream.dataset: windows.application
      - name: System
        data_stream.dataset: windows.system
      - name: Security
        data_stream.dataset: windows.security

outputs:
  default:
    type: logstash
    hosts: ["@logstash.host:@logstash.sslPort"]
    loadbalance: true
    ssl:
      enabled: true
Copy hosts and SSL from Install Integration for Elastic Agent — same stack ports as Winlogbeat, different YAML shape (ssl.enabled nested under ssl). Run the agent elevated; Security still needs audit policy. Discover fields often arrive under data-stream naming (data_stream.dataset, event.code, host metadata) rather than classic type: wineventlog — filter on channel/dataset, not the Winlogbeat field set alone.
Failure modes: metrics land and Event Log does not because only system/metrics was left enabled; YAML indentation broke the winlog streams; Fleet-managed examples pasted into a standalone agent without Logit’s Logstash output.
Path 3: Fluent Bit winevtlog → HTTP TLS
Logit’s Fluent Bit page documents the output side: HTTP JSON lines over TLS to the stack Logstash SSL port. On Windows, pair that with Fluent Bit’s winevtlog input (vendor docs call it out for Event Log channels — link those pages with the usual external-rel rules when you cite them). Minimal shape:
[INPUT]
    Name         winevtlog
    Channels     Application,System,Security
    Interval_Sec 1

[OUTPUT]
    Name http
    Match *
    Host @logstash.host
    Port @logstash.sslPort
    tls On
    Format json_lines
    json_date_format iso8601
    json_date_key @timestamp
Required: exact Host/Port from Install Integration, tls On, and channel names Windows accepts. Older configs used windows_eventlog; current Fluent Bit Windows builds prefer winevtlog — mismatch means the process starts and reads nothing.
Discover documents look like JSON HTTP payloads, not Beats ECS by default. You may see flatter channel/event id keys unless you add parsers. Plan field aliases or a Logstash filter before you alert on winlog.channel. Failure modes: TLS off against an SSL-only port; Docker examples from the docs run on Linux and cannot open Windows channels; timezone on @timestamp skews Discover’s last-15-minutes window so the pipe looks dead.
Unlock complete visibility with hosted ELK, Grafana, and Prometheus-backed Observability
Path 4: OpenTelemetry Collector → OpenSearch exporter
OpenTelemetry Collector on Logit.io documents an OpenSearch exporter aimed at https://@logs_id-es.logit.io with basic auth from Endpoints — that is the Hosted OpenSearch write path for OTel logs. The sample receiver is OTLP. Windows Event Log is not OTLP natively; use a Windows Event Log receiver on the Collector (OpenTelemetry Collector Contrib’s windowseventlog receiver is the usual choice) and keep Logit’s exporter/auth block:
extensions:
  basicauth/logs:
    client_auth:
      username: "@elasticsearch.username"
      password: "@elasticsearch.password"
receivers:
  windowseventlog/application:
    channel: Application
  windowseventlog/system:
    channel: System
  windowseventlog/security:
    channel: Security
exporters:
  opensearch:
    logs_index: otel-windows
    http:
      endpoint: https://@logs_id-es.logit.io
      auth:
        authenticator: basicauth/logs
service:
  extensions: [basicauth/logs]
  pipelines:
    logs:
      receivers: [windowseventlog/application, windowseventlog/system, windowseventlog/security]
      exporters: [opensearch]
Credentials and the -es host come from Stack Settings → Endpoints on the Logs/OpenSearch stack — not from the Logstash SSL port used by Beats. Index name is yours; create or template it before a mapping surprise. Discover fields follow the OTel/OpenSearch exporter shape (body, resource attributes, severity) more than Winlogbeat’s winlog.* tree.
Failure modes: OTLP-only config with nothing emitting; wrong username/password taken from the MCP or metrics key; Contrib receiver missing from a core Collector build; bulk rejections when the index mapping explodes on unbounded event message fields — fix templates before you add nodes.
Path 5: WEF collector → ForwardedEvents → Winlogbeat
NXLog is not a first-party Install Integration on Logit.io today, and the syslog docs target rsyslog TLS into Logstash — fine for Linux relays, not a native Windows Event Log reader. The Windows-native scale-out pattern Logit already samples is Windows Event Forwarding: source hosts subscribe into a collector’s ForwardedEvents channel, then one Winlogbeat reads that channel.
On the collector, keep Path 1’s Logstash output and enable the ForwardedEvents entry from the official sample:
winlogbeat.event_logs:
  - name: ForwardedEvents
    tags: [forwarded]

output.logstash:
  hosts: ["@logstash.host:@logstash.sslPort"]
  loadbalance: true
  ssl.enabled: true
  pipeline: "winlogbeat-%{[agent.version]}-routing"
WEF subscription health is a Windows problem first — empty ForwardedEvents means the collector never received events, not that Logstash rejected them. Winlogbeat’s sample disables add_host_metadata when tags contains forwarded so the origin host is not overwritten by the collector. In Discover filter tags: forwarded or winlog.channel: ForwardedEvents and use the origin computer fields Winlogbeat preserves.
Failure modes: Winlogbeat on a source host watching ForwardedEvents that is always empty; collector Winlogbeat running as a user that cannot read the forwarded channel; backpressure when an entire domain’s Security flood hits one beats worker — widen channels slowly, then tune ingest settings rather than guessing throughput numbers.
Discover fields and shared failures
After the service is Running, launch OpenSearch Dashboards from the stack. Widen the time picker past fifteen minutes; Windows clocks and UTC display disagree often enough to hide a good pipe. Useful checks:
winlog.channel/event.codefor Winlogbeat and WEF pathsdata_stream.datasetfor Elastic Agent winlog streams@timestamppresence for Fluent Bit JSON lines- index
otel-windows(or your exporter index) for Collector traffic
Shared killers across all five: wrong Install Integration stack; SSL port closed egress; Security without SeSecurityPrivilege / audit policy; dynamic mapping growth from noisy rendered messages; shipper-side queue growth when OpenSearch bulk rejects — that last one is an ingest-settings problem, covered in production high-ingestion settings, not a reason to swap shippers mid-incident.
Get started
Create a Log Management stack (or dedicated OpenSearch if the Collector exporter path is the goal), open Install Integration or Endpoints, and pick one path that matches the agent you already operate. Land Application, System, and Security. Only then add Sysmon, PowerShell operational, or ForwardedEvents. Start from the Winlogbeat, Elastic Agent, Fluent Bit, and OpenTelemetry Collector docs, the Hosted OpenSearch overview, and OpenSearch pricing when you size nodes.