


Teams often shop Hosted OpenSearch node tiers before they can state how many primary bytes arrive on a busy day. That order is backwards. On Logit.io the cluster is already managed — at least two nodes, upgrades handled — so capacity work starts as a volume and settings problem: how much primary store grows per day, how shippers batch it, and which OpenSearch knobs keep bulk writes from fighting refresh and shard overhead. Published developer tiers start from $45.52/node/mo annual on OpenSearch pricing; buy that tier after you know the day’s shape, not before.
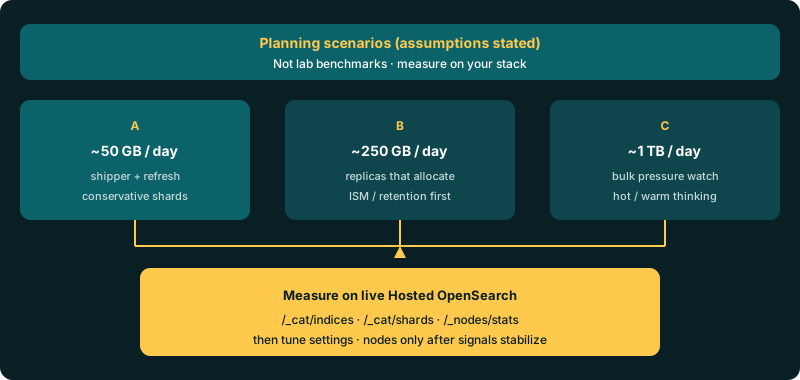
This post is a planning and measurement method for three daily volume scenarios — roughly 50 GB, 250 GB, and 1 TB of primary bytes per day. The tables below are planning scenarios with stated assumptions, not lab benchmarks. No invented docs/sec, GB/hour, or latency percentiles. Sister posts already cover the knobs you will tune: production high-ingestion settings and shard sizing with CAT APIs. Here you decide which scenario you are in, then prove it on a live stack.
Contents
- Size the day in primary bytes before picking nodes
- Scenario A — ~50 GB/day: shipper, refresh, shard starting point
- Scenario B — ~250 GB/day: when replicas and ISM matter first
- Scenario C — ~1 TB/day: bulk pressure, hot/warm thinking, what to watch
- How to measure on a live Logit Hosted OpenSearch stack
- Failure modes to budget for
- Get started
Size the day in primary bytes before picking nodes
Convert “we generate a lot of logs” into a primary-byte estimate before you open the pricing page. Prefer pri.store.size growth over raw shipper file sizes: compression, multiline events, and enrichment change the footprint that lands on disk. A practical planning formula:
estimated_primary_GB_per_day ≈ (avg_event_bytes × events_per_day) / 1e9
# then add headroom for replicas, merges, and retention copies you will keep hot
Assumptions to write down (even if rough): average event size after parsing, peak-to-average ratio, retention days kept on hot indexes, and whether you need one replica that actually allocates. Peak hour often matters more than the daily average — a flat 50 GB day is easier than the same 50 GB compressed into a four-hour deploy window.
If you do not have a stack yet: create an OpenSearch cluster, copy the REST host from Stack Settings → Endpoints, and follow connect to your cluster. Measurement calls go through the host documented in the OpenSearch REST API guide.
Scenario A — ~50 GB/day: shipper, refresh, shard starting point
Planning scenario (assumptions): ~50 GB primary growth per day, modest peak-to-average, one write index pattern, retention short enough that tiny-shard floods are the bigger risk than mega-shards. Goal: stable bulk with conservative shard math — not maximum theoretical throughput.
| Planning lever | Starting point to verify on your stack |
|---|---|
| Shipper / pipeline | Batch at the edge; prefer Logstash or documented bulk chunks (see Document APIs) over giant single payloads |
refresh_interval | Widen beyond the default one-second cadence during sustained write windows; restore shorter values when search freshness wins |
| Primary shards | Start small (often one primary on small hosted tiers); grow count only when measured primary size would outrun a recovery window you accept |
| Replicas | Zero for disposable backfills; one when search must survive a node bounce and your node count can place the copy |
At this volume the common failure is oversharding daily indexes into sub-GB toys. Use the shard sizing guide’s CAT path before you multiply primaries “for performance.” Pair that with the high-ingestion post’s refresh_interval and bulk guidance so you are not solving a refresh storm by adding nodes.
Scenario B — ~250 GB/day: when replicas and ISM matter first
Planning scenario (assumptions): ~250 GB primary growth per day, multi-hour peaks, at least one replica for hot indexes, retention long enough that delete/rollover policy must be explicit. Goal: keep replica allocation green and bound disk with lifecycle — still before a node shopping spree.
| Planning lever | What changes vs Scenario A |
|---|---|
| Replica math | Confirm every replica has a different data-bearing node; yellow after a replica bump is settings math until proven otherwise |
| ISM / retention | On Logit.io, retention is typically plan-aware; treat upstream ISM gists as drafts, not drop-ins — see the API overview |
| Templates | Bake refresh, shards, replicas, and mappings into templates so every rollover inherits them (index templates) |
| Bulk sizing | Stay inside documented batch ranges; very large /_bulk bodies time out per managed stack limitations |
This is where teams confuse “need more nodes” with “need fewer, healthier indexes.” If /_cat/indices shows dozens of tiny hot indexes and unassigned replicas, fix templates and replica count first. Node tiers on OpenSearch pricing still matter — they just are not the first dial.
Unlock complete visibility with hosted ELK, Grafana, and Prometheus-backed Observability
Scenario C — ~1 TB/day: bulk pressure, hot/warm thinking, what to watch
Planning scenario (assumptions): ~1 TB primary growth per day, sharp peaks, multiple write indexes or high cardinality sources, retention that forces a hot vs warm conversation. Goal: keep indexing pressure visible and isolate write indexes so merge/refresh work does not stall search — still without publishing fake throughput numbers.
- Bulk pressure — shrink batches and widen refresh before you rewrite shard counts mid-incident; Document APIs guidance (roughly 1,000–5,000 documents per bulk) is the operational ceiling to test against, not a promise.
- Hot / warm thinking — keep the write alias on indexes tuned for ingest; move older indexes off the hottest path via rollover and plan retention rather than one ever-growing mega-index.
- Mapping discipline — dynamic mapping explosions hurt worse at TB scale; lock high-cardinality fields as
keywordin templates before the first production bulk. - Watch list — rejected bulk, rising indexing pressure under
/_nodes/stats, yellow replica allocation, andpri.store.sizeclimbing faster than your rollover plan.
Dedicated Hosted OpenSearch is the right product when OpenSearch itself is the workload. Shipper-first log pipelines still belong on log management (from $25/mo on the public tables; metrics from $12/mo; APM from $20/mo). Many teams run both — do not duplicate the same stream across two stacks just to “have OpenSearch.”
How to measure on a live Logit Hosted OpenSearch stack
Replace spreadsheet hope with CAT and stats on the stack you will run. Useful calls (add ?v for headers where supported):
GET /_cat/indices?v&h=index,health,pri,rep,docs.count,store.size,pri.store.size
GET /_cat/shards/{index}?v
GET /_cluster/health?pretty
GET /_nodes/stats/indices/indexing,indices/search,os,jvm?pretty
Read pri.store.size day over day on the write index to validate which planning scenario you actually inhabit. /_cat/shards proves replica placement. /_nodes/stats surfaces indexing pressure and resource signals when bulk slows — interpret trends on your workload; do not treat a single snapshot as a vendor scoreboard. Cluster and CAT behaviour is documented under Cluster & CAT APIs; index create/settings live under Index & Template APIs; bulk behaviour under Document APIs.
Capture a baseline before template changes, then again after the next rollover so you can tell whether the new settings stuck. Dev Tools in OpenSearch Dashboards uses the same Endpoints credentials as curl.
Failure modes to budget for
- Refresh storms — default one-second refresh competing with sustained bulk; widen
refresh_intervalduring write windows. - Tiny-shard floods — too many sub-GB primaries; fewer shards or longer rollover until measured primary size leaves the toy range.
- Mapping explosions — unbounded dynamic fields; templates and explicit mappings before more hardware.
- Bulk timeouts — oversized
/_bulkbodies; shrink chunks per Document APIs and managed stack limitations. - Yellow replica math — more replicas than nodes can place; lower replicas or add capacity that can hold copies.
Windows shipper paths change how fast events arrive, not the primary-byte math — see five ways Windows Event Logs reach OpenSearch and the Winlogbeat 8 → 9 canary when the fleet is the variable.
Get started
Write down a primary-byte estimate for a busy day, pick scenario A/B/C honestly, and encode refresh, shards, and replicas in a template before the next rollover. Prove the plan with /_cat/indices, /_cat/shards, and /_nodes/stats on your Hosted OpenSearch stack. Ground the product in the OpenSearch overview, the Hosted OpenSearch overview, and node pricing on OpenSearch pricing. For the knob-by-knob ingest checklist, continue with production high-ingestion settings; for primary size decisions, use shard sizing on Logit.io.
Size the day. Measure the stack. Scale nodes last.