


Most “Datadog alternatives” pages become feature checklists. The job you actually have is a cutover: keep critical logs searchable at the retention you need, recreate the monitors that page people, and regain control of ingest and cost. This guide walks Datadog Log Management → Logit.io onto Hosted OpenSearch (or a log management stack when that is the better landing pad) — shippers, indexes, Discover, monitors, managed limits, and honest pricing. For positioning only, see the Datadog alternative page and the older listicle Datadog alternatives and competitors; the body below is the migration path, not another top-N roundup.
Contents
- When Datadog Log Management migration is the job
- Choose log stack or Hosted OpenSearch as the landing pad
- Retire Datadog Agent pipelines with supported shippers
- Prove indexes, patterns, and Discover fields
- Datadog monitors vs OpenSearch Alerting parity
- Respect managed Hosted OpenSearch limits
- Price the cutover without mixing product lines
- Datadog-specific failure modes
- Start the Datadog cutover
When Datadog Log Management migration is the job
Migration is the right framing when cost, retention ceilings, or operational control — not a missing product checkbox — is why you are leaving Datadog Log Management. You care about which hosts still run the Datadog Agent with logging enabled, which pipelines and facets power the queries you page on, and which monitors must fire on day one. Feature matrices do not shrink that backlog.
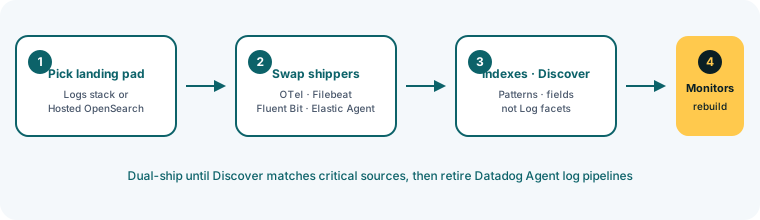
Treat the project as parallel ingest, prove Discover coverage for the critical sources, recreate the monitors that matter, then retire Agent log pipelines. Do not plan a big-bang historical export unless compliance forces it; most teams need continuity of new events more than a perfect archive copy of every old Log Management index.
Choose log stack or Hosted OpenSearch as the landing pad
Logit.io exposes OpenSearch in two shapes. A log management stack is the shipper-first path: OpenTelemetry, Filebeat, Fluent Bit, Elastic Agent, and friends land logs for Discover, dashboards, and operational alerting. A dedicated Hosted OpenSearch cluster is cluster-first — you provision nodes, connect clients to the endpoint, and treat OpenSearch as the search/analytics backend.
If success means “replace Datadog Log Management for ops,” start with a log stack (log management plans start from $25/mo annual). If success means “OpenSearch as a managed search cluster with your own indexes and APIs,” create a dedicated cluster via Creating an OpenSearch cluster. The decision walkthrough lives in Log stack vs Hosted OpenSearch; those are the two options. Landing-pad choice matters more than matching Datadog feature names one-for-one.
Retire Datadog Agent pipelines with supported shippers
The Datadog Agent and its log pipelines do not become OpenSearch clients by flipping a toggle. On Logit you point documented shippers at the stack endpoints from Settings → Endpoints:
- OpenTelemetry — Collector-first estates that already standardize on OTel for logs (and often metrics/traces).
- Filebeat — file and many host log paths; closest mental model to “tail files and ship.”
- Fluent Bit — lightweight agents, Kubernetes DaemonSets, and multi-input collectors.
- Elastic Agent — unified agent paths when your fleet already uses Elastic integrations.
Prefer OTel, Filebeat, Fluent Bit, or Elastic Agent as appropriate for a Datadog Agent log replacement — stick to those documented shippers. New to shipping anything on Logit? Pair this cutover with first logs on Logit.io so the first source proves end-to-end before you scale hosts.
Practical cutover: dual-ship a canary host or namespace into Logit while Datadog still receives the same stream. Confirm volume and fields in Discover, then flip the remaining fleet. Leaving the Agent dual-shipping only to Datadog is not a migration.
Unlock complete visibility with hosted ELK, Grafana, and Prometheus-backed Observability
Prove indexes, patterns, and Discover fields
Datadog Log Management facets and OpenSearch fields share a purpose and little else in the UI. On Logit, events land in OpenSearch indexes (often time-based or source-shaped). In OpenSearch Dashboards you create an index pattern (for example logs-*) that Discover uses to search across matching indexes. First value is not a perfect facet port — it is: pick the pattern, set the time field, run a simple query for a known host or service, and confirm the fields you page on are present and typed.
Habits to drop early: expecting Datadog facet names to appear unchanged, and treating Log Management pipeline processors as if they were OpenSearch index templates. Prefer structured fields at ship time so Discover filters and aggregations stay cheap. Map a short “must-have” field list from your Datadog monitors and saved views (host, service, severity, env) and verify those fields before you recreate dashboards.
Datadog monitors vs OpenSearch Alerting parity
Datadog monitors do not import as OpenSearch monitors. Agent pipelines and Log Management alert definitions do not map 1:1 onto OpenSearch Alerting — that is the counter-intuitive part most feature checklists skip. On Logit, recreate paging rules with OpenSearch Alerting monitors: pick a data source, define the query or filter, set a trigger threshold, and attach a notification action. Start with the handful of alerts that page humans; leave noisy informational monitors for a second wave.
Honest parity gaps: composite monitors, anomaly-style thresholds, and rich Datadog notification templating will not 1:1 onto a single OpenSearch monitor query. Move enrichment into the pipeline where possible, or accept a simpler trigger plus a Discover runbook. Do not promise “every Datadog monitor becomes an OpenSearch monitor unchanged” — inventory severity and rebuild the top tier deliberately.
Respect managed Hosted OpenSearch limits
Hosted stacks expose the OpenSearch REST API for search, indexing, and day-two index work, but they are not a self-managed cluster you can re-topology at will. Read managed stack limitations before you script a Datadog-era automation habit onto the endpoint.
Plan around: no customer security-plugin admin via /_plugins/_security; no adding/removing nodes or installing arbitrary plugins via API; snapshot/restore lifecycle is platform-managed; some cluster settings are rejected or overridden. Practical OpenSearch defaults still apply — for example index.max_result_window at 10,000 hits per search — so large exports need scroll or batched patterns, not a single giant result window. Contact support for topology or recovery cases the dashboard does not expose.
Price the cutover without mixing product lines
Dedicated OpenSearch pricing is per node: published developer tiers start at $45.52/node/mo (annual). Cluster cost scales with node count × tier — two DEV-1-1-10 nodes are two × that rate on the published table, rather than a custom TCO estimate. Confirm current node sizes on the live pricing page when you size for retention and ingest.
If you chose a log management stack instead of a dedicated cluster, price log retention and ingestion on log plans (from $25/mo annual). Keep OpenSearch per-node rates for dedicated clusters; the $25/mo log-plan starting price is not Hosted OpenSearch cluster pricing. Metrics (from $12/mo annual) and APM (from $20/mo annual) only enter the bill when those products are in scope. Any scenario table you build for finance is a planning assumption unless you measured your own ingest; use the published starting prices rather than adding extra ones.
Datadog-specific failure modes
- Wrong landing pad. Building custom search indexes on a Logs stack — or shipping only ops logs to a dedicated cluster without a log pipeline story — creates the wrong operating model. Re-read the stack-type choice before you scale shippers.
- Agent still dual-shipping only to Datadog. Dual-ship until Discover shows the canary; then cut. Leaving half the fleet on Datadog Agent log pipelines alone is not a migration.
- Confusing Log Management facets with OpenSearch fields. Prove fields and time range in Discover first; port queries after the data shape is stable.
- Expecting Datadog monitor imports. There is no import path. Recreate paging monitors first; port informational alerts after ingest is stable.
- Ignoring managed limits. Scripts that assume self-managed security APIs, plugin installs, or snapshot repos will 403 — that is platform design, not a misconfigured password.
- Pricing mix-up. $45.52/node/mo is Hosted OpenSearch; $25/mo is the log management starting price. Mixing them in a business case sinks trust with finance.
Start the Datadog cutover
Open a 14-day trial, choose log stack or dedicated Hosted OpenSearch from the decision above, and create the cluster (or stack) with the docs for creating an OpenSearch cluster when you need the dedicated path. Point one OpenTelemetry, Filebeat, Fluent Bit, or Elastic Agent canary at Settings → Endpoints, confirm Discover, stand up the first OpenSearch Alerting monitor, then scale shippers and retire Datadog Agent log pipelines source by source. Size dedicated nodes on OpenSearch pricing from $45.52/node/mo when the landing pad is Hosted OpenSearch.