
Security
10 min read
Last updated:
Datadog is one of the most highly rated tools for network monitoring, application performance monitoring & log analysis. The platform is highly rated by engineers for its wide range of useful features, high integrability and support of both custom configurations and reporting dashboards.
Datadog’s pricing plans split out their offerings of infrastructure monitoring, network monitoring, APM, container monitoring, log management and security monitoring into separate packages so tailoring this solution to fit an entire organisation’s IT needs across a wide range of use cases can quickly become expensive.
Unfortunately, whilst being a favourite tool of many developers and ops engineers, there are a large number of users who run into issues with scale and affordability over time. Add this together with users who experience initial difficulty with onboarding and configuration, this leads many users to look for alternatives to Datadog each month.
Because of these significant factors around price and data growth, current Datadog users (or those still considering all of their available monitoring options) may wish to broaden their knowledge by learning more about the best alternatives to Datadog and the various other Datadog competitors currently operating.
In this guide, we’ve gathered information on some of the most commonly compared alternatives to Datadog for your convenience.
Contents
What is Datadog?
Datadog is a cloud monitoring and analytics solution that supplies extensive visibility into the performance of applications, infrastructure, and networks. The platform is effective in providing its users with the ability to deep dive into their IT infrastructure, including applications, and systems. In order to monitor their IT environment, rectify issues, guarantee security, and enhance the overall performance of your application or system. Its robust full-stack monitoring capabilities and commitment to supplying end-to-end visibility help to distinguish itself in the realm of monitoring solutions.
What is Datadog used for?
Datadog is a cloud-based monitoring and analytics platform used primarily for monitoring and observability in modern IT environments. It is commonly used for several purposes across organizations, including enhancing the performance and security of your applications or systems. This makes Datadog a versatile tool for various teams and roles.
Why are users searching for alternatives to Datadog?
While Datadog is a powerful monitoring and analytics platform, it is not without its drawbacks. Here are some potential downsides to consider:
1. Cost
Datadog can be expensive, especially for small to medium-sized businesses. As you scale and add more features, the costs can quickly add up, making it less affordable for some organizations.
2. Complexity
The platform's extensive features and capabilities can be overwhelming for new users. The learning curve can be steep, requiring significant time and resources to fully understand and utilize all the tools available.
3. Performance Overhead
In some cases, the monitoring agents used by Datadog can introduce performance overhead, potentially affecting the performance of the systems being monitored.
4. Data Retention
Datadog's data retention policies may not meet the needs of all organizations. Some users may find the retention periods too short for their requirements, necessitating additional data storage solutions.
5. Integration Issues
While Datadog integrates with many technologies, there can be challenges with certain integrations. Users have reported issues with compatibility and the need for additional configuration to ensure smooth operation.
6. Alert Fatigue
The platform's alerting system, while robust, can lead to alert fatigue if not properly configured. Users may receive a high volume of alerts, making it difficult to prioritize and respond effectively.
7. Limited Customization
Although Datadog offers customizable dashboards, some users find the customization options limited compared to other platforms. This can be a drawback for organizations with very specific monitoring and reporting needs.
Datadog Alternatives
5. Logit.io
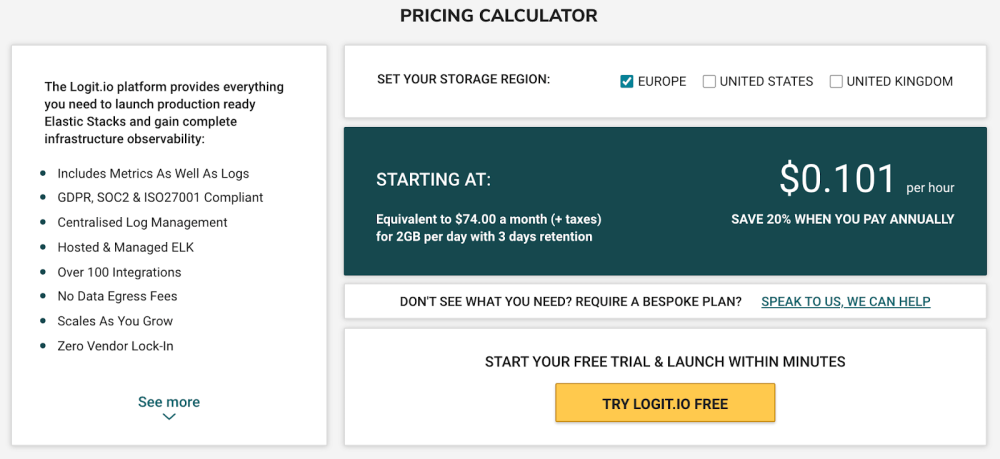 The Logit.io platform provides a scalable alternative to Datadog by offering affordable log management, infrastructure monitoring and application performance monitoring within a single centralised data platform that offers easy to understand and fully transparent billing.
When compared as a Datadog alternative, Logit.io is currently rated 5 out of 5 stars on Software Advice compared to Datadog’s 4.5 score. The Logit.io platform also includes hosting for the following fully-managed open-source software: ELK (consisting of Elasticsearch, Logstash & Kibana), Grafana & Open Distro for Elasticsearch.
Key Features:
- Unlimited users
- No vendor lock-in
- No data egress fees
- Unlimited querying
- Database monitoring
- Overusage protection
- Easy to understand billing
- Autoscaling open platform
- Fully managed upgrade paths
- Two-factor authentication (2FA)
- Enterprise uptime SLAs available to 99.999%
- Highly available data centres in EU, UK and US regions
1. Solarwinds
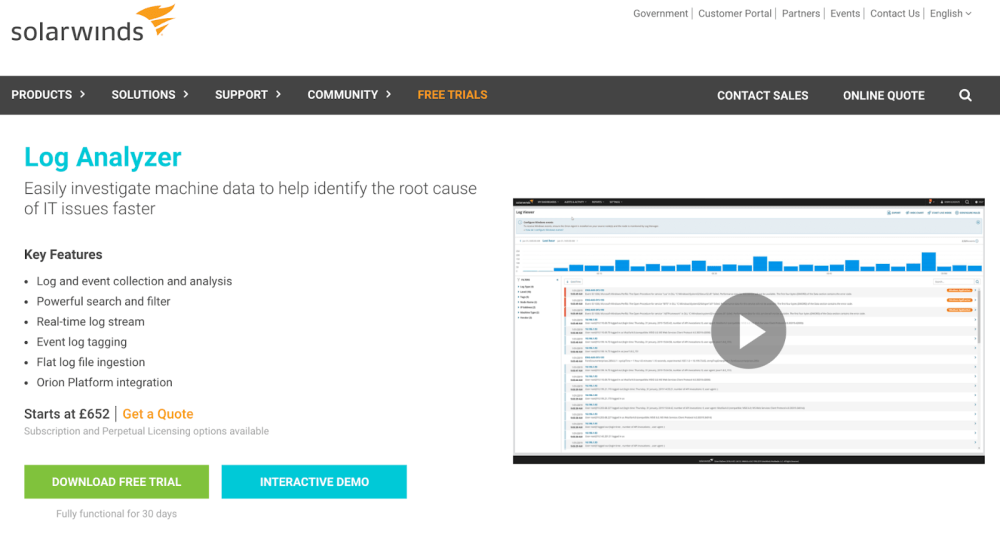 Solarwinds provides solutions for not only network and infrastructure monitoring but also offers features for the monitoring of IT systems in general through their various products. You may have heard of their other solutions previously which operate under the name Papertrail & Loggly.
If we compare Solarwinds vs Datadog based upon their strengths and reputation as security service and monitoring providers there may be many users who would immediately flag Solarwinds negatively because of their relatively recent data breach without knowing that Datadog themselves also suffered a breach, albeit, this was back in 2016.
When comparing Solarwinds against Datadog we found that Datadog is rated higher for server monitoring performance, ease of deployment, integration with sources and higher availability of support documentation (scores sourced from Gartner).
Key Features:
- Storage resource monitor
- Application management
- Database management
- ITSM Platform
- IT Security
Request a Demo
Want to learn more about Logit.io's powerful observability platform? Book a demo and we'll walk you through the extensive capabilities and discuss your requirements in detail.
2. Splunk
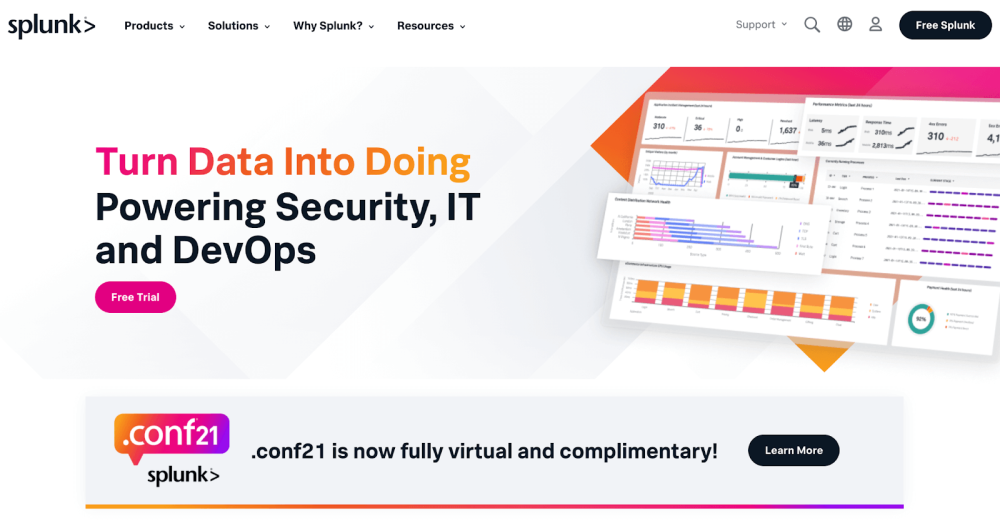 Splunk is one of the most notable data analysis platforms in the marketplace and with integrations for PagerDuty, Wazuh, GuardDuty, OverOps and Rsyslog it is has shown itself to be highly interoperable with the majority of security tech stacks used by engineers today.
When it comes to making the comparison between Splunk vs Datadog, it is important to consider that Splunk is very well suited for enterprise use cases where a single organisation may wish to monitor in excess of 100,000 devices.
If we look at feedback from real users across a range of criteria comparing Splunk vs Datadog we can see that Splunk is rated higher for its ability to monitor networks, hypervisors and their understanding of customer needs (scores sourced from Gartner).
Key Features:
- Infrastructure monitoring
- Collect and index data
- Analyse and monitor
- Application delivery
- Compliance
3. AppDynamics
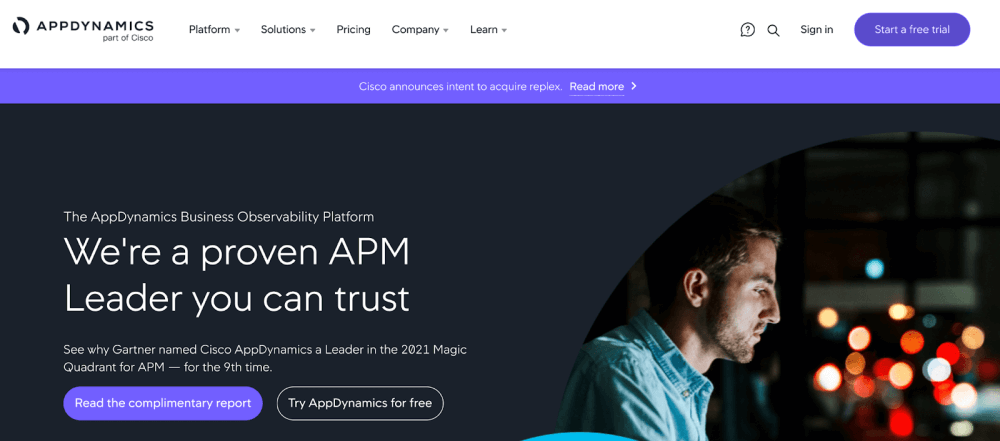 AppDynamics is a full-stack application performance management (APM) tool that was acquired by Cisco in January 2017. For new users considering whether or not to make the choice between Datadog vs AppDynamics, we’ve compiled some of the leading benefits that Appdynamics has shown significant strength in demonstrating.
These include a higher rating on their overall range of features (Source: Capterra), the availability of in-person training options & (according to Stackshare) real-time business transaction monitoring which Datadog does not currently mention on their comparison page.
Users across engineering forums have also mentioned in previous years that AppDynamics had much less of a significant learning curve for new users to navigate in order to successfully onboard onto this platform
Key Features:
- Application performance monitoring
- Business performance monitoring
- Infrastructure monitoring
- End-user monitoring
- Database monitoring
4. New Relic
 New Relic offers AIops, APM, distributed tracing, browser monitoring, infrastructure monitoring and synthetics monitoring to over 10,000 companies around the world.
Whilst Datadog’s APM has many strengths, when we compared these two platforms we noted that based on user feedback comparing New Relic vs Datadog that New Relic is rated higher overall than Datadog at 4.6 stars and was particularly rated higher for their technical support and platform training (scores sourced from Gartner).
In terms of which company has been operating the longest, New Relic takes the lead on Datadog as the former platform was created all the way back in 2008 compared to Datadog’s 2010 founding date. Both New Relic & Datadog offer log management and integration with sending logs from the main cloud service providers, such as AWS & Microsoft Azure.
Some engineers have warned of burnout that they experienced due to New Relic's lack of onboarding support with one engineer stating that it took three engineers an entire year to completely onboard the solution.
Key Features:
- Proactive anomaly detection
- Incident intelligence events
- Unlimited querying
- Synthetics checks
6. Dynatrace
 Dynatrace provides a software intelligence monitoring tool that aims to simplify cloud monitoring to accelerate troubleshooting and error resolution for engineers.
We discovered based on feedback from real users comparing Dynatrace vs Datadog that Dynatrace is rated higher than Datadog for their quality of technical support and end-user training. Both of these tools were given the same scores on ease of deployment and quality of their peer user communities (scores sourced from Gartner).
Key Features:
- Complete dependency mapping
- Infrastructure monitoring
- Automatic entity model
- Business analytics
- AIOps
- APM
7. LogicMonitor
 LogicMonitor offers users a fully automated observability platform that is built with monitoring datacenters as the primary focus of their solution.
We found that based on previous reviews comparing LogicMonitor vs Datadog that LogicMonitor is rated more favourably than Datadog for ease of use and value for money. Both tools were given the same score of 4.5 out of 5 stars on overall functionality and customer support (scores sourced from Software Advice).
LogicMonitor’s platform is well known for its ability to cater to managed service providers (MSPs) by offering fully automated hybrid monitoring for complex IT environments, it may be little known but Datadog also offers its solutions to MSPs via their partners page so it seems that the solutions are evenly matched on this particular benefit.
Key Features:
- Dynamic services monitoring
- Configuration monitoring
- Database monitoring
- Monitor 199 devices
- Dashboards
8. Honeycomb
 Honeycomb is a platform for monitoring production servers, distributed services and troubleshooting the user experience of your services and applications.
When comparing Honeycomb vs Datadog we found that Honeycomb is rated higher for ease of use, customer service, features and value for money so this platform may be well worth considering as an alternative to Datadog (scores sourced from Capterra).
Unlike many providers in this space Honeycomb provide overusage protection (as Logit.io does also), which means that if you do happen to go over your plan limits, your data will not be automatically lost as they give users a grace period to resize their plan upwards.
Key Features:
- Query result permalinks
- Open telemetry support
- Activity & team history
- Distributed tracing
- Unlimited triggers
- Single-Sign on
9. Prometheus
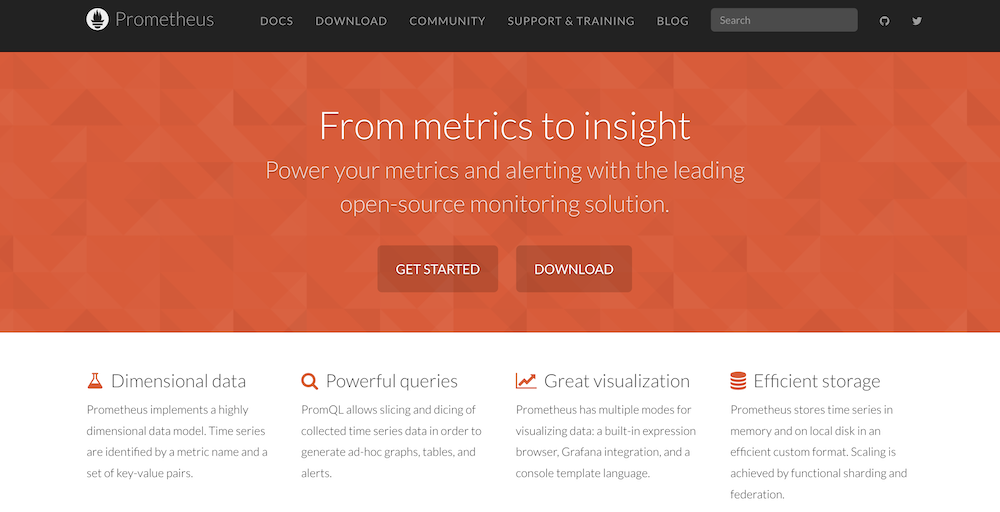 Prometheus is an open-source monitoring and alerting toolkit designed for reliability and scalability. Developed originally by SoundCloud, Prometheus joined the Cloud Native Computing Foundation (CNCF) in 2016 and has since acquired widespread adoption in the DevOps and cloud-native communities.
Prometheus works on a pull-based model, where it often scrapes metrics endpoints exposed by services and applications. This approach streamlines the architecture and makes it simple to add new services for monitoring.
Comparing Datadog against Prometheus, we found that Prometheus is rated higher overall at 4.4 out of 5 stars on G2. As well as this, Prometheus is rated higher for ‘has the product been a good partner in doing business?’ at 8.8, compared to Datadogs 8.5. As part of our platform, Logit.io provides full hosting for Prometheus, allowing users to get started with this within minutes.
Key Features:
Provides a flexible and scalable monitoring solution for large environments
PromQL and Alertmanager provide powerful alerting and querying
Service Discovery
Integration with Grafana
Simple deployment process along with easy installation
10. Sematext
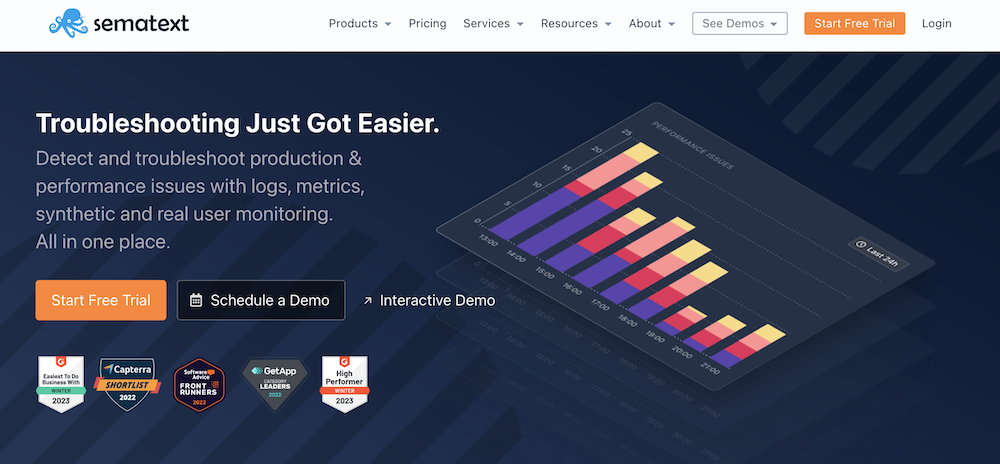 Sematext is an observability platform that provides a suite of tools and services for monitoring, logging, and analyzing the performance of applications and infrastructure. It is designed to offer extensive insights into system behavior, allowing organizations to troubleshoot issues, enhance performance, and guarantee the reliability of their systems.
Sematext aims to distinguish itself from competitors by pulling together all related monitoring tools that organizations need, such as performance monitoring tools, logging tools, and user experience monitoring. This enables users to troubleshoot performance issues faster and in turn benefit from better visibility for DevOps, SysAdmins, and SREs.
When comparing Sematext and Datadog, Sematext comes out on top. According to G2, Sematext is rated 4.7 out of 5 from customer reviews of the overall product. Also, Sematext is rated 9.4 (compared to Datadogs 8.3) regarding quality of support.
Key Features:
- Metrics Monitoring
- Real user monitoring
- Alerting with anomaly detection
- Tracing and APM
- Infrastructure Monitoring
If you enjoyed this article then why not take a look at our in-depth guide on the top 60 log management solutions?