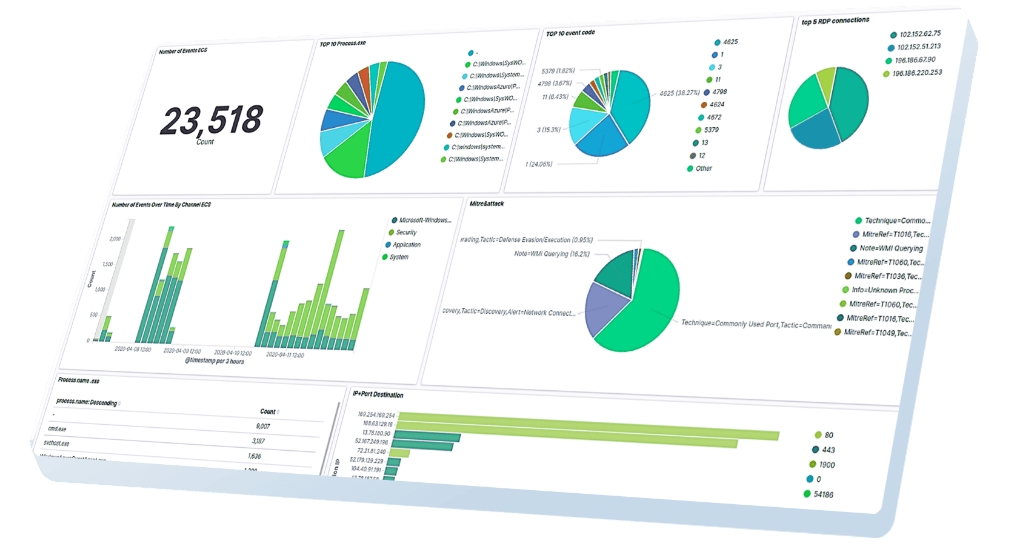
When a single user action can easily trigger a complicated series of knock-on events across front-end and back-end services, trace analytics allows you to discover any issues that may have happened within this sequence of events.
This series of events can be referred to as traces. A set of traces is called a distributed transaction. As one of the main pillars of observability (logs, metrics, and traces), tracing is vital for monitoring transaction level tracking. Because of the limitations of manual debugging for analyzing traces, it is beneficial to use a robust analytics platform for analyzing what can often be massive amounts of data. Logit.io aims to help you discover patterns versus outliers, establish correlations, and derive insights that would otherwise be buried within individual traces.
Common analytics use cases include service dependency graphs, critical path analysis, error analysis, latency analysis, and anomaly detection. In order to troubleshoot high latency or error requests, trace analytics can be used by engineers. Additionally, trace analytics can determine the root cause of code issues by breaking down time spent on CPU, garbage collection, lock contention, and improving CPU utilization. While logs and metrics remain significant, ultimately it's going to be tracing that will solve the transaction processing issues that your system is encountering.


