Get a DemoStart Free TrialSign In
  • maersk
  • gds
  • honest
  • xneelo
  • ringier

Trusted By Thousands

The move to containerized applications and microservices architecture has transformed the way we develop and deploy applications. It is crucial to monitor the performance of these containers and ensure that they are available 24/7 and that there are no security or performance issues.

Kubernetes is the tool of choice for many DevOps to run containers on clusters of virtual machines and many enterprises are opting for Kubernetes-as-a-Service (KaaS) models to deploy and manage Kubernetes clusters.

A variety of tools can be used for monitoring Kubernetes environments, including monitoring solutions which are native to Kubernetes. However, these tools often lack interoperability with other monitoring systems, making it difficult to truly understand the health of an entire enterprise application environment. Many of these tools often do not provide user-friendly interfaces or dashboards to help users make sense of what's happening within their clusters. By using Logit.io you can get started with monitoring Kubernetes, alongside Docker and a wide variety of additional data sources.

calendar

Book A Demo

Want to request a demo or need to speak to a specialist before you get started? No problem, simply select a time that suits you in our calendar and a member of our technical team will be happy to take you through the platform and discuss your requirements in detail.

Book Your Demo
Why should you Monitor Kubernetes? Why should you Monitor Kubernetes?

Why should you Monitor Kubernetes?

Kubernetes is the most popular container orchestration platform for deploying, scaling and operating containerised applications. Kubernetes provides APIs for scheduling containers onto nodes in a cluster, replication controllers to ensure that a specified number of copies of a container are running, service discovery to find services inside the cluster, and health checking to monitor the availability of pods.

One way to ensure the expected performance of containers in Kubernetes is with a monitoring platform. Kubernetes monitoring helps your development teams and operations teams effectively manage your cluster.

Logit.io's Kubernetes monitoring solution is built for monitoring both production and development clusters, as they monitor the status of containers, nodes, and network resources. The Logit.io platform can provide a wealth of information about the pods currently running and nodes of the cluster, as well as send error alerts.

Key Kubernetes Metrics to Monitor

Visualising Kubernetes metrics is an excellent way to monitor and manage your clusters, nodes, pods, and applications. Here are some of the most useful Kubernetes metrics that you can visulise in Logit.io hosted Kibana reporting dashboards.

Node Resources: this metric monitors the readiness, disk or processor overload, memory, memory requests, memory limits, allocatable memory, memory utilization, CPU requests and network availability of deployed clusters.

Cluster state metrics: this metric monitors Node status, desired pods, current pods available and unavailable pods and their health.

Kubernetes events: Monitor how pod creation, deletion, starting, and halting affects the performance of your infrastructure by collecting events from Kubernetes.

Control plane metrics: The control plane is Kubernetes' brain and heart. The cluster's optimal operation and efficiency rely on all of its components. Monitoring the state of the Kubernetes control plane is just as critical as monitoring the nodes or apps operating inside.

Key Kubernetes Metrics to Monitor
Real-Time View of your Cluster's Health

Real-Time View of your Cluster's Health and Performance

Monitor Kubernetes clusters in real-time and at cluster-wide scale with Logit.io. Monitor the master and all the worker nodes in a cluster and report on processes (Pods, Engines, and Nodes) in each node by using Kibana for visualisation.

Keep track of CPU and memory allocation and utilization, and see your entire cluster at a glance

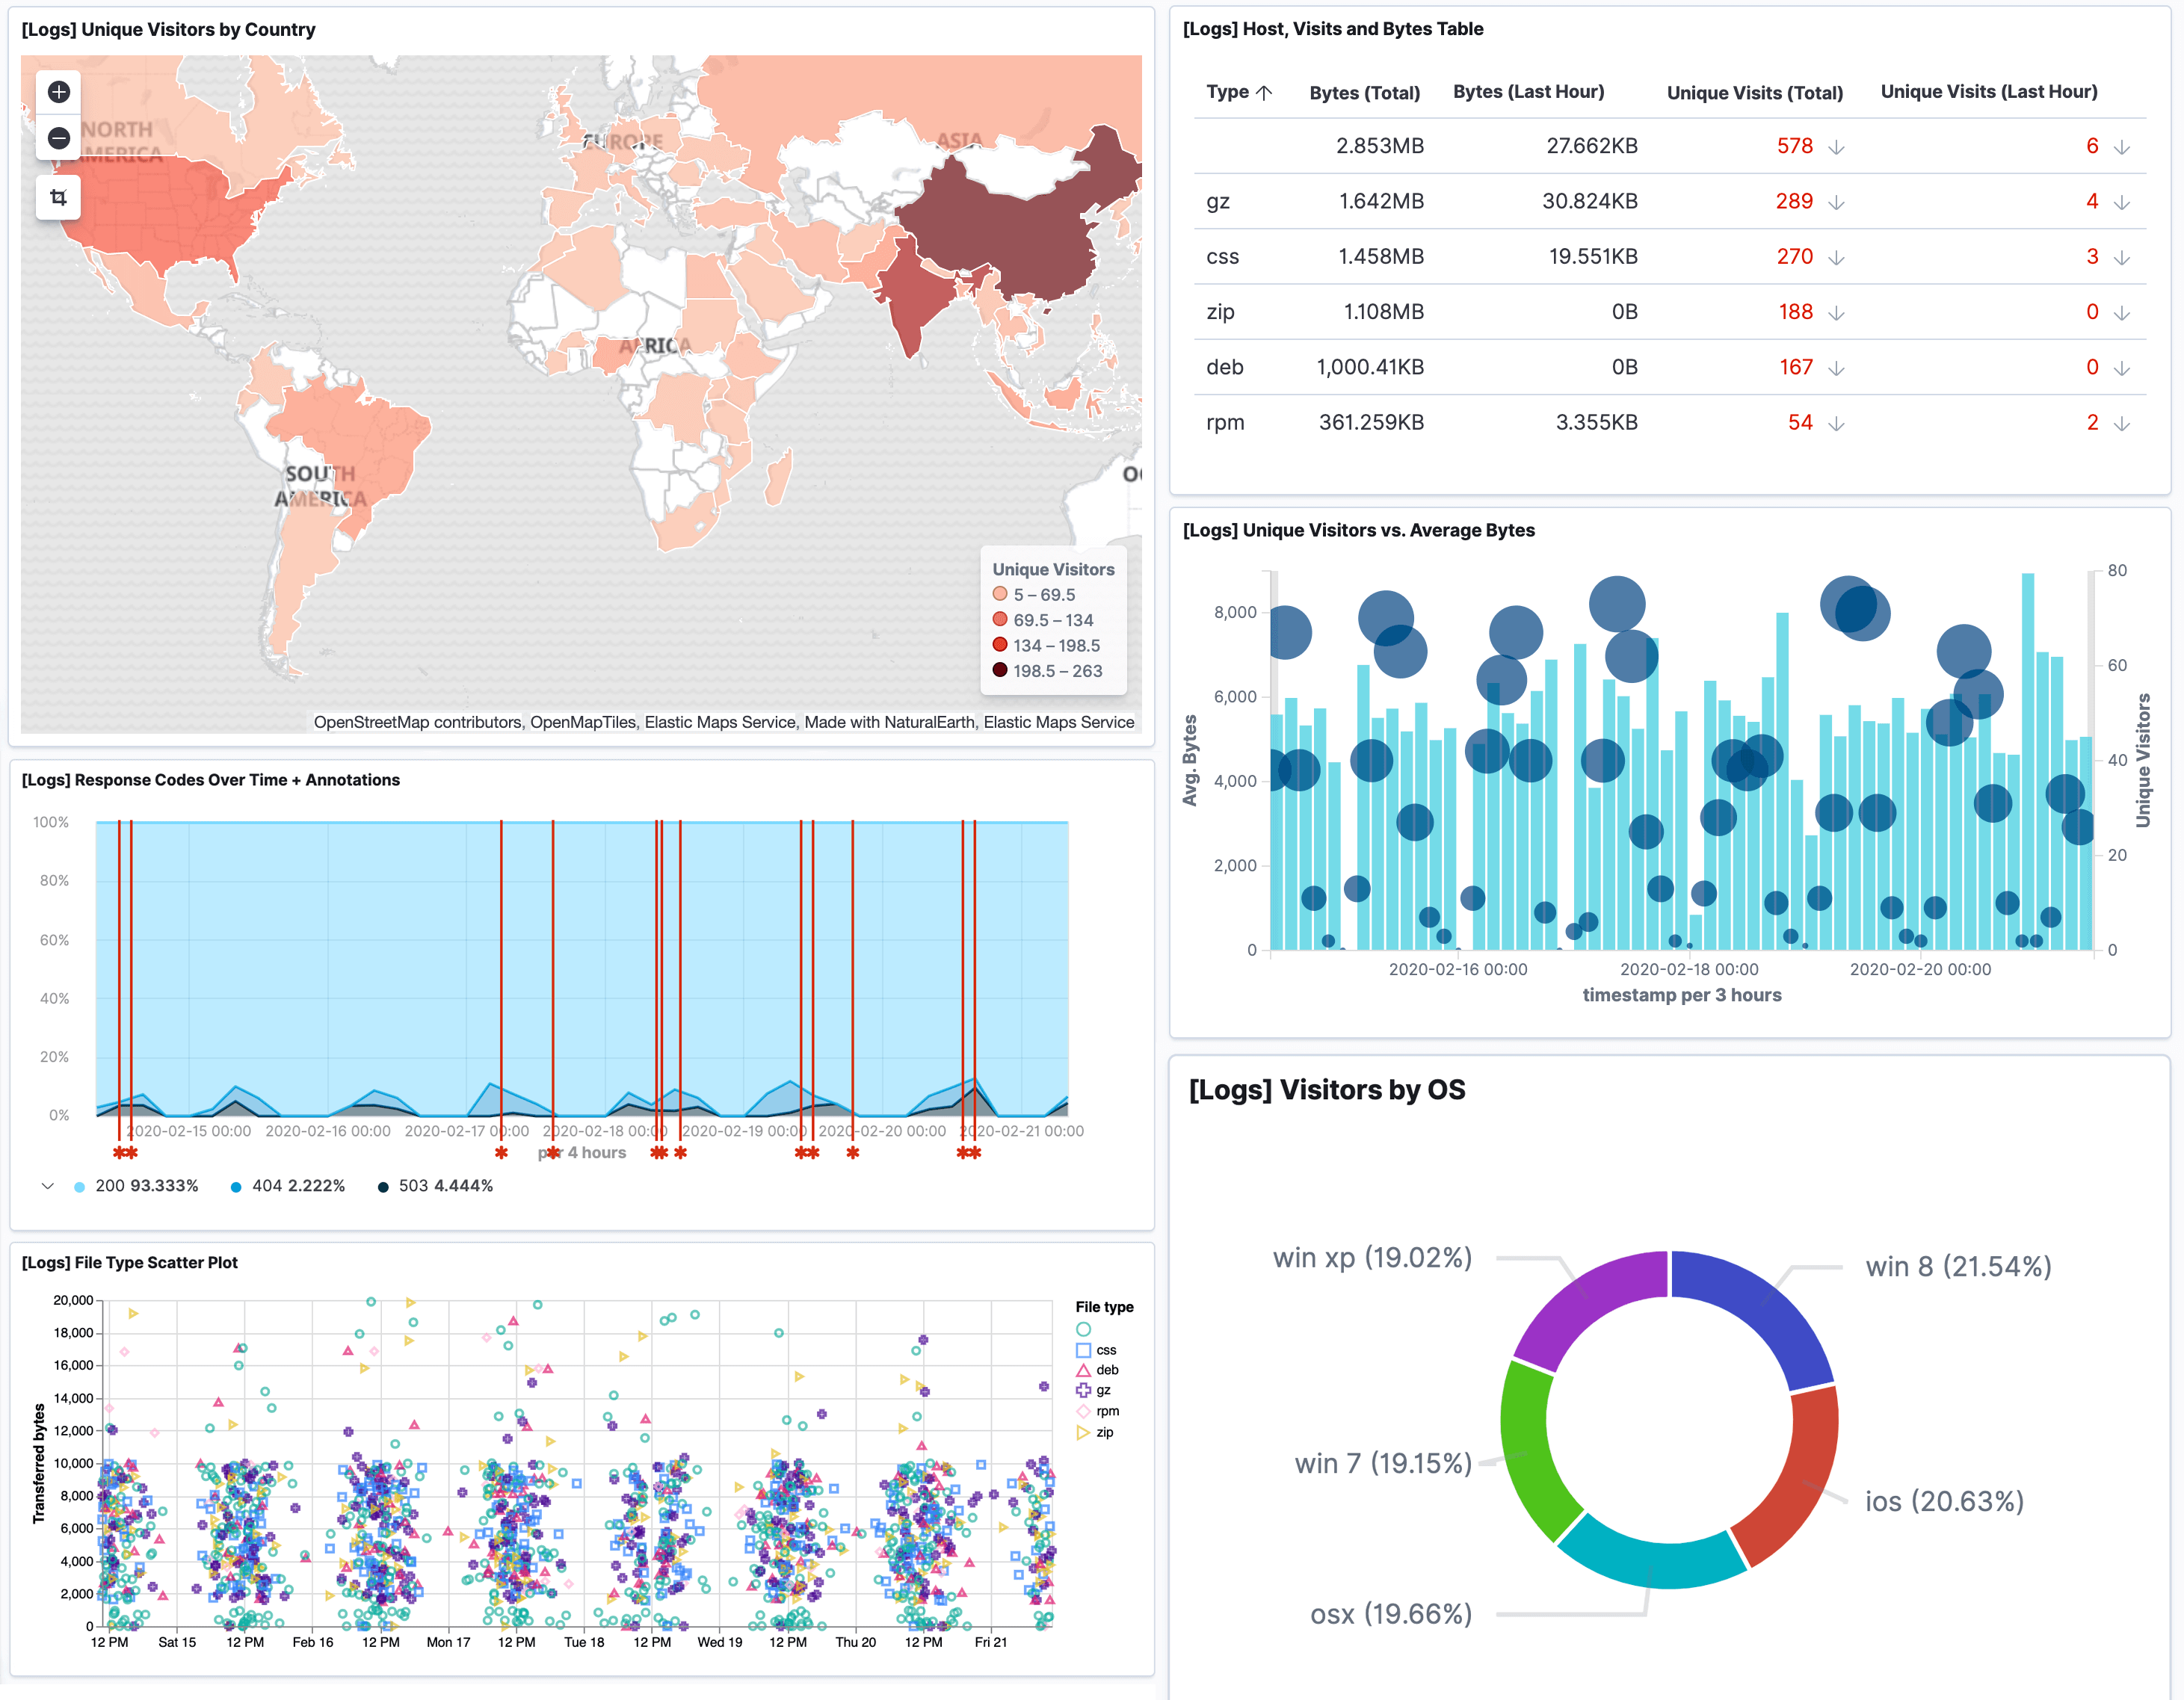
Use Logit.io's Kubernetes Monitoring Dashboard to help you keep track of your namespaces, pods, services and deployments and display the status of your cluster and the health of every namespace associated with it.

Visualize, alert on, and diagnose the entire state of your Kubernetes cluster in one place. Whether you have 1 node or 1000, the Logit.io platform gives you deep visibility into the health and performance of your Kubernetes infrastructure.

Companies Feel The Difference When They Use Logit.io

"Internally, Logit.io has made it easier for us to provide better support for our customers, since finding individual messages based on various data in the payload has become easier.

At Youredi, pretty much everyone from our technical support teams through to our professional services teams uses Logit.io."

Mats von Weissenberg, CTO @ Youredi

Youredi testimonial

"One thing is certain when operating in the startup space, a strict budget. Before we make any purchase decision to use a SaaS Log Management platform, we need to validate the benefits of the platform and more importantly the team behind the platform.

Logit.io's customer support team stood out. Right from the beginning, the Logit.io team was there to answer questions and walk us through the process."

Ioannis Sintos, Co-Founder & CIO - Uizard

Uizard testimonial

Logit.io offers our company an excellent solution of ingesting our logs, we recently had to do quite a few updates on the platform since the previous service owner in our company left and didn't want to do them, Logit.io was of great assistance throughout the whole process.

Thierry Gysin, Co-Founder & CIO - Ringier

Ringier testimonial

Automated Monitoring

Track pods, nodes, container resource allocations and utilization, readiness, scheduling, and more with Logit.io.

Monitor clusters and services to keep tabs on their health and performance. Spot problems before they affect users or your business: for each pod in a namespace, track its readiness and schedule, CPU and memory allocation and utilization, visualise volume usage, and more.

Take advantage of rich and actionable analytics and visualizations to get a complete picture of your cluster's resource usage and determine how much new workload you can add without overloading your nodes.

Monitor the status of the application services linked with each namespace, as well as the age of the service type and the pods that are connected to each service.

Get tighter control of your deployments and be aware of how they're doing. Get alerted to failed jobs, failed pods, and the longest-running jobs. Run all the metrics you need on managed or unmanaged clusters.

Automated Monitoring
Plan. Deploy. Scale. Visualise.

Plan. Deploy. Scale. Visualise.

Taking action often starts with gaining better visibility, and Logit.io gives visibility across your entire infrastructure. Logit.io gives users the power to parse and analyse data from their Kubernetes clusters and add alerting rules based on meta-objects such as Deployments, Pods, and other elements.

Easily onboard and collect metrics from services running on Kubernetes-provisioned containers.

If you wish to go beyond visualising Kubernetes data and wish to explore how trace analytics can assist your application development then why not consider using Logit.io's APM solution.

Read more about Application Performance Monitoring (APM)go

Logit.io For OpenTelemetry

With OpenTelemetry (OTel) and Logit.io, you can gain end-to-end observability effortlessly. Essentially, OpenTelemetry standardises all data from any source, enabling automated analysis and as a result, saves engineers hours every month.

With Logit.io for OpenTelemetry, your data is completely centralized, unified and secure, with this compliance and production-ready distribution of the OpenTelemetry project.

All major observability vendors must support the OpenTelemetry protocol going forward, therefore choosing an analysis service that already supports OpenTelemetry will future-proof your operations.

Find out more about OTelgo
logit.io for OTellogit.io for OTel
calendar

Book A Demo

Want to request a demo or need to speak to a specialist before you get started? No problem, select a time that suits you in our calendar and a member of our team will be in touch.

Book Your Demo

© 2024 Logit.io Ltd, All rights reserved.