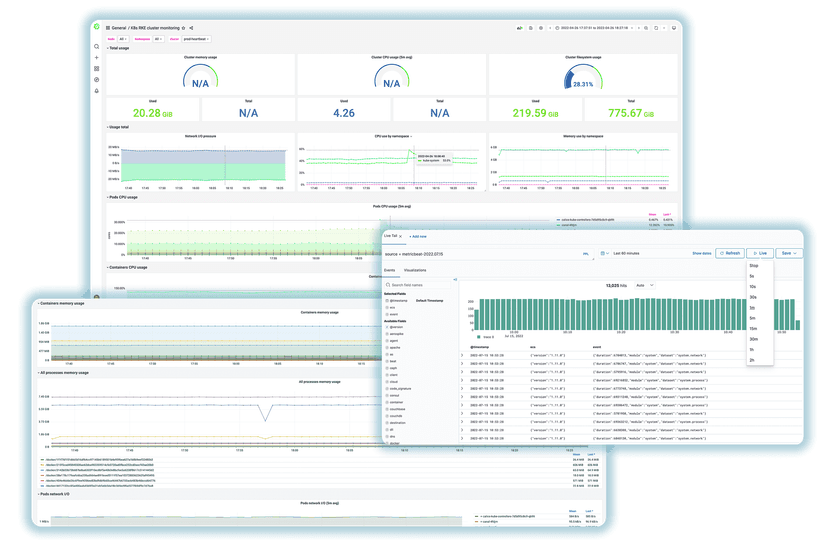
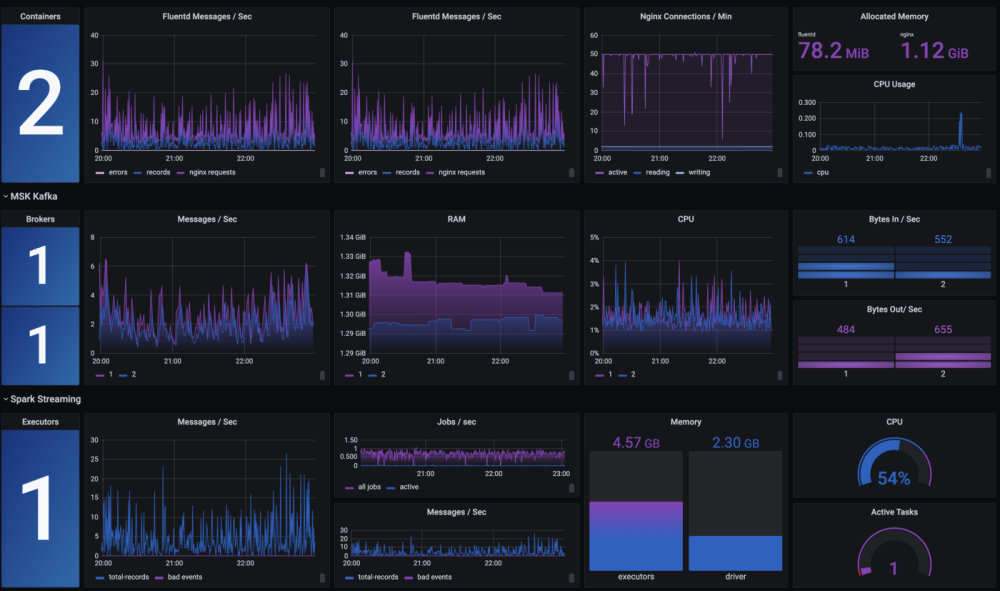
With our ELK Stack Application Monitoring solution, you can utilize numerous metrics to attain unparalleled insights and enhanced performance.
Response Time: Delve into the heartbeat of your application with precise response time metrics. Identify and resolve bottlenecks swiftly, ensuring lightning-fast interactions for your users.
Error Rate: Keep your application error-free and your users happy with real-time error rate monitoring. Pinpoint issues before they escalate, maintaining a seamless user experience.
Throughput: Gauge the efficiency of your application's data processing capabilities with throughput metrics. Optimize resource allocation and ensure smooth operations, even during peak usage periods.
Latency: Dive deep into latency metrics to understand the speed at which your application communicates with its dependencies. Fine-tune network configurations and enhance overall performance.
Resource Utilization: Gain valuable insights into CPU, memory, and disk utilization metrics to optimize resource allocation and avoid performance bottlenecks.
Transaction Tracing: Trace the journey of every user transaction through your application, uncovering inefficiencies, and optimizing workflows for a seamless user experience.


