
Log Management
9 min read
Last updated:
Users of open-source log collectors and log monitoring solutions often prefer these solutions due to them being well suited for speed, flexibility and their ability to attract talented contributors who are willing to invest time to maintain technology projects they are passionate about.
With open source logging tools, developers and system administrators can capture, analyze, and visualize logs without the heavy licensing fees associated with their proprietary equivalents. Most of these solutions offer leading features that include integrations with existing systems, scaling to accommodate large volumes of data, and customization for a wide array of use cases. In this blog, we will review the best open source logging tools available, their features, strengths, and how they can help streamline your logging strategy.
Contents
1. Logit.io
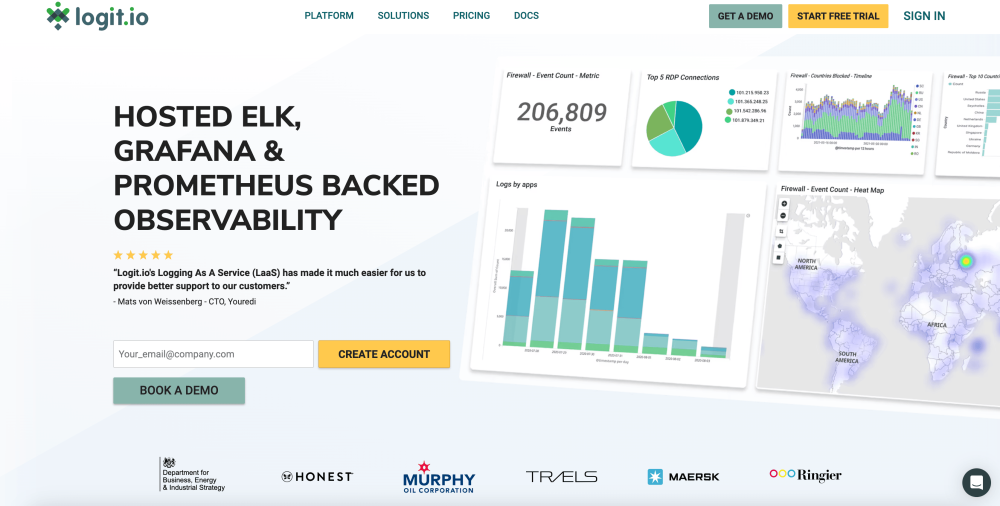 Logit.io features first in our list of open-source logging tools, which is likely no surprise. Our solution combines the best open-source tooling with a quick and simple onboarding and setup, making it worthy of the top spot. Logit.io provides a highly affordable solution that included hosted ELK and allows you to experience the best benefits from an open-source log analysis tool with high availability and SLAs up to 99.999%.
Unlike some services the Logit.io platform is not limited to only log management. With Logit.io, you can access infrastructure metrics, and APM alongside log management through the observability suite. By opting for Logit.io you gain access to hosted Grafana, hosted OpenSearch, hosted Jaeger, and hosted Prometheus, offering your organization flexibility for monitoring and reporting. The capabilities of Logit.io are extensive, if you’re interested in finding out more about Logit.io, either for log management or for one of our other solutions, then don’t hesitate to contact us or begin exploring the platform for yourself with a free 14-day trial.
Logit.io is also rated 5/5 stars on Capterra, Software Advice and Gartner.
Features include:
- Highly available Elasticsearch, Prometheus and Grafana side-by-side
- Centralised Logging, Metrics and Tracing in a single pane view
- Highly rated and knowledgeable Support Engineers
- Quick and easy onboarding process with extensive documentation
- Advanced role-based access controls
- Lightning-fast deployment
- Hundreds of integrations with detailed integration guides for leading sources including Python, Serilog, and .NET
- Compliance & auditing
- Alerting & notifications
Unlock complete visibility with hosted ELK, Grafana, and Prometheus-backed Observability
Start Free Trial2. Graylog
 Graylog is a well established open-source log management as a service solution that is used by Sysadmins and DevOps engineers alike. Users of this solution often state that whilst configuring and maintaining the solution on-premise was somewhat difficult to maintain, choosing to use this solution saved them greatly in comparison to typical licensing fee costs for tools such as Splunk (discover more Splunk alternatives).
Key Features:
- Log collector configuration
- Fault tolerance
- Content packs
- SIEM tool
3. GoAccess
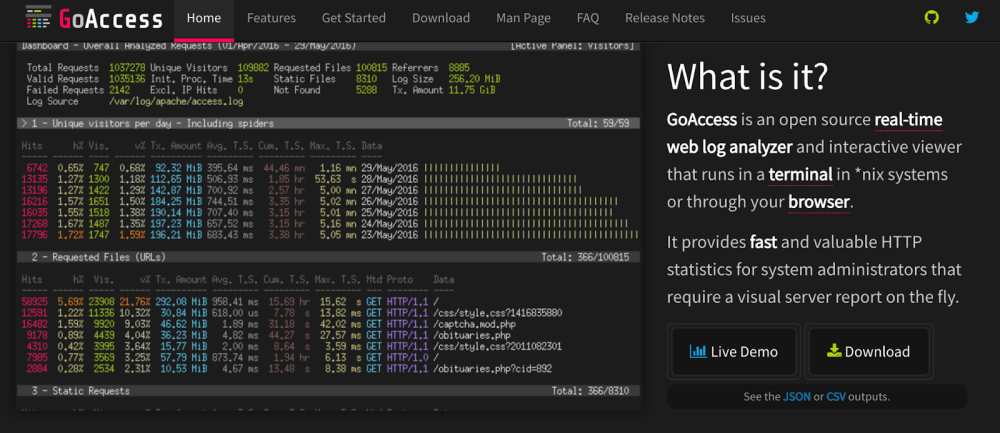 GoAccess has been touted by users for its usefulness in providing quick insights for use cases such as timely web server reporting without the need to generate entire extensive reporting dashboards. GoAccess supports any custom log format as well as a number of popular predefined log file types including S3, CloudFront, Apache and Nginx logs.
Key Features:
- Minimal configuration
- Terminal dashboards
- Web log analyser
- HTTP statistics
4. Syslog-ng
 Syslog-ng is most commonly used by system administrators, in part due to its ability to reliably dump Syslog events to files. This takes very little configuration and this open-source tool can easily handle log data transfers of upwards of 100MB.
Periodically, users will post on software support forums that they are having difficulty with configuring Syslog-ng to ingest Syslogs, so if you are short on time it may be worth you considering using another open-source log aggregator that is easier to configure.
Key Features:
- Open source log management
- tamper-proof storage
- Big data ingestion
- Optimise SIEM
- Rapid search
5. Nagios
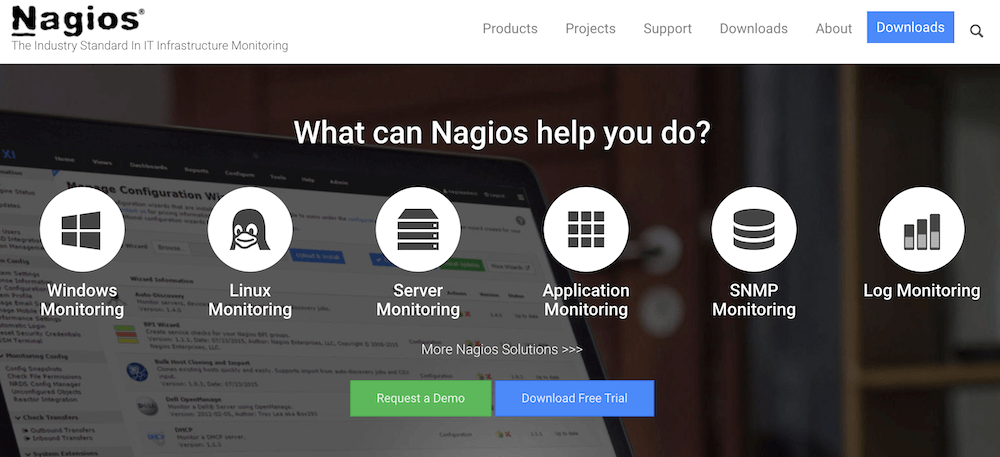 The open-source log monitoring solution provided by Nagios allows for log monitoring to be conducted across a variety of applications and operating systems. Nagios can be fully integrated with a number of third-party tools including PagerDuty, OpsGenie, Flowdock, VictorOps and ElementaryOS.
One of the most common complaints about Nagios is that scaling this tool can be notably tedious to achieve successfully and users may also feel the pain of troubleshooting issues when configuring a tool that is notably older than many of its contemporaries (Nagios was released all the way back in 2002).
Key Features:
- Application monitoring
- Windows monitoring
- Server monitoring
- SNMP monitoring
- Linux monitoring
- Log monitoring
6. LOGalyze
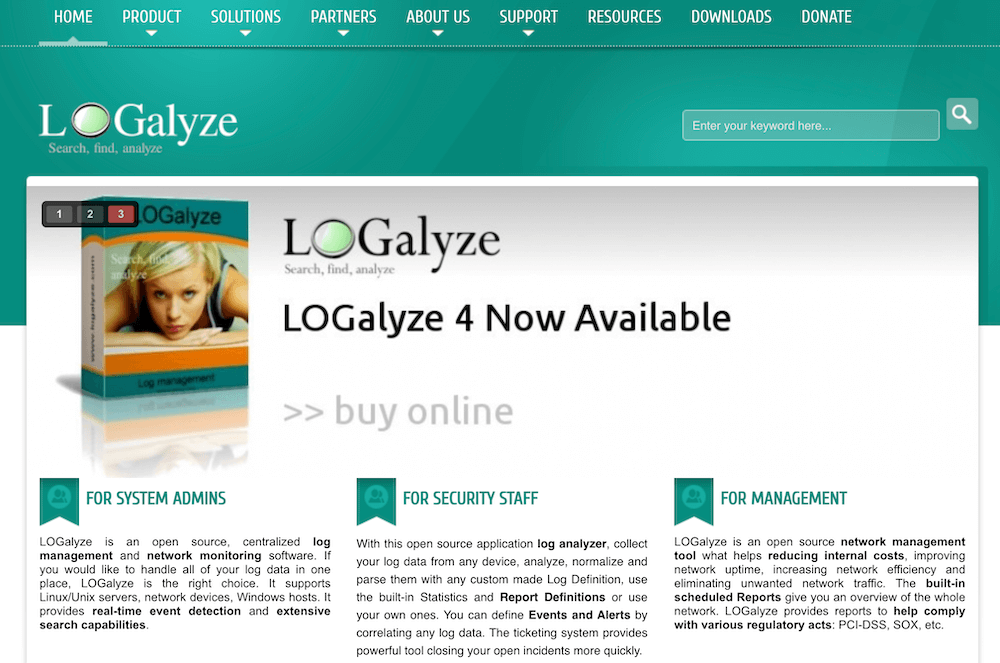 LOGalyze was specifically built as an open-source solution that offered network monitoring and log management. If you needed to house data from Linux servers, network devices and Windows hosts then LOGalyze was able to offer both real-time event detection and extensive search capabilities for these use cases.
Unfortunately since August 2021, the official LOGalyze website has been down and new users are unable to download the tool (As commented by user David Koňařík on Twitter at August 26th 2021). Since the beginning of 2020 it seems that the Logalyse team were not responding to requests for support based upon their lack of response to user @Evolutionsec for their query posted on the 27th of January 2020.
In light of this, it is worth considering an alternative solution to support your logging activities.
Key Features:
- Collect log data from any device
- Real-time event detection
- Scheduled reports
7. ELK Stack
 The ELK Stack is composed of several complementary logging offerings including Elasticsearch, Logstash and Kibana.
Elasticsearch is a powerful & fast search and analytics engine that is well known for its ability to suggest intelligent results based on prior search queries and returns accurate results for any near matches.
Logstash is a powerful, flexible pipeline that works as an extract, transform & load (ETL) tool for collecting log messages and forwarding them onto Elasticsearch for visualisation within Kibana.
Kibana is an open-source visualisation and reporting user interface that allows users to create visualisations from a variety of data inputs. Kibana can be easily used to create pie charts, heat maps, line graphs, scatter plots and more. Unfortunately, while the ELK Stack was considered one of the foremost open-source logging solutions, the company behind this technology stack, Elastic, decided to release version 7.11 (and all versions onward) under dual license SSPL (Server Side Public License). This means that if you want to keep your log collector open source, you will need to stick to using versions prior to this release or the alternative, OpenSearch solution.
If you prefer to have the option to use OpenSearch, Open Distro or another legacy version of the ELK Stack then you should consider using a managed service such as Logit.io that provides these solutions as ready to launch Stacks.
Key Features:
- Inverted indexes for faster search querying
- Over 100+ compatible integrations
- BKD trees for geodata
- Instance balancing
8. Logary
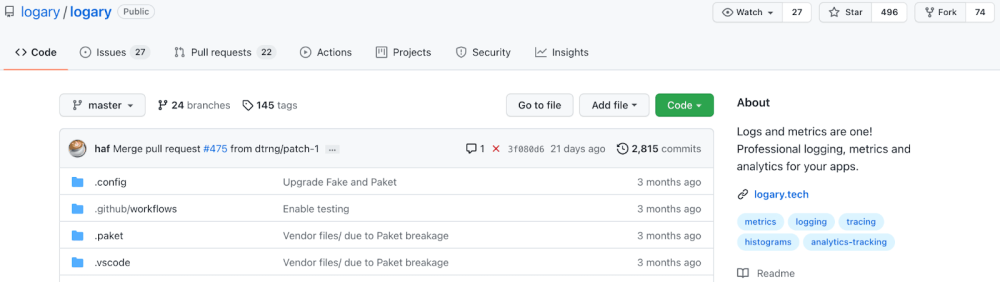 Logary offers a high-quality logging library built for .Net and Javascript applications. Logary is also fully able to perform health checks and gather metrics for .Net.
Unfortunately, upon looking at the official resource website for Logary, it is apparent that a number of pages have been deleted and the last version of this library was released over two years ago. In light of this, this service may very well benefit from more contributions being made to this tool’s Github repository.
Key Features:
- App metric and log analysis
- Never throw exceptions
- F# idiomatic code
9. Fluentd
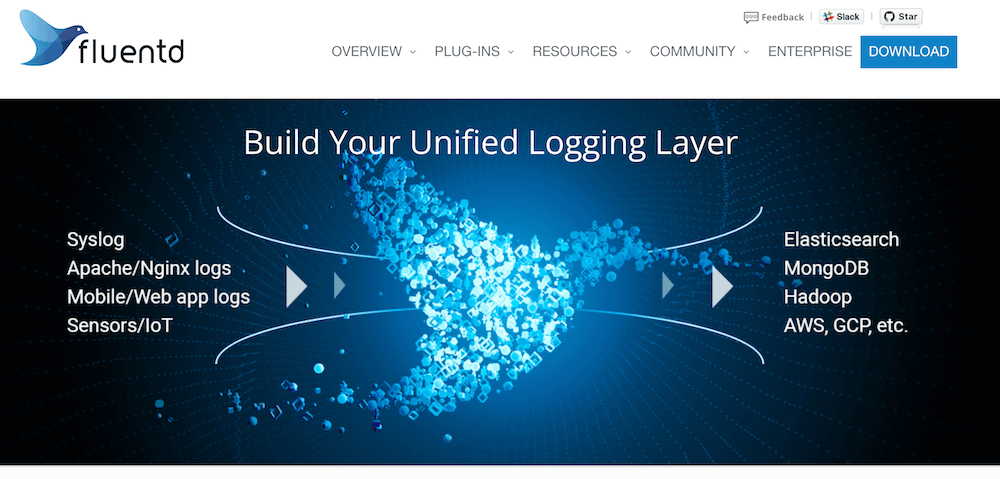 Fluentd is suitable for use as an open-source log collector that supports memory and file-based buffering to prevent inter-node data loss. Companies that currently use FluentD include Alibaba, Colondee, Yousign and Paralect. Fluentd boasts an extensive array of integrations including pre-existing integrations available for Google's BigQuery, Logmatic, Honeycomb, Coralogix and Sematext.
Key Features:
- Active community support
- Easy to deploy plugins
- Unified logging layer
10. Watch My Logs

Watch My Logs is a logging tool that is designed to be Docker and Warden friendly. It also serves as an exception trace renderer, compatible with HTML and XML formatters. Watch My Logs also provides users with the ability to smartly jump to file suggestions and leverages mixed mode for SQL inside PHP errors. Additionally, it offers instant log scanning using incremental reads, ensuring efficient and up-to-date log analysis.
Key Features:
- Smart file jump
- Log scanning
11. Parseable

Parseable is a log observability engine designed for the cloud. It is built using the Rust programming language and leverages Apache Arrow and Parquet for its underlying data structures. One of its key features is its streamlined and index-free data organization and querying mechanism, which enables rapid ingestion and retrieval with minimal latency and high throughput.
Key Features:
- Ingestion API
- Schema free design
- Choose your backend
12. Log Owl

Log Owl is a tool that tracks errors across a wide range of services. The platform offers insights and intricate information, facilitating faster issue resolution. By prioritizing data security, it also provides detailed analytics on website visitors while prioritizing user privacy. Users can choose between the option of hosting Log Owl on their own infrastructure for free or opting for the managed service option.
Key Features:
- Error tracking
- Self-Hosted
- Precise event count
Summary Table
| Tool | Key Features | Strengths | Limitations | Ideal For |
|---|---|---|---|---|
| Logit.io | Centralized logging, metrics, tracing, compliance | High availability, fast deployment | Not purely open-source | Businesses needing diverse monitoring |
| Graylog | Log collector, fault tolerance, SIEM tool | Well-established, cost-effective | Difficult on-premise setup | Sysadmins, DevOps |
| GoAccess | Minimal configuration, web log analyzer, HTTP stats | Quick insights, supports custom log formats | Limited to web server reporting | Web server administrators |
| Syslog-ng | Log management, tamper-proof storage, big data ingestion | Reliable, handles large data transfers | Complex configuration | System administrators |
| Nagios | Application, server, and log monitoring | Wide integration with third-party tools | Tedious to scale, troubleshooting issues | Various OS monitoring |
| LOGalyze | Log data collection, real-time event detection, reports | Network monitoring, real-time detection | Website down, no new downloads available | Network devices, Linux servers |
| ELK Stack | Elasticsearch, Logstash, Kibana, extensive integrations | Fast search, powerful visualizations | Licensing changes, requires managed service | Comprehensive data analysis |
| Logary | .Net and Javascript app logging, health checks | High-quality library, app metrics | Lack of recent updates | .Net and Javascript developers |
| Fluentd | Unified logging layer, easy deployment, active community | Extensive integrations | Potential for data loss without proper setup | Companies needing diverse logging |
| Watch My Logs | Docker friendly, exception trace rendering, log scanning | Smart file jump, efficient log analysis | Niche tool for Docker and PHP errors | Docker and PHP developers |
| Parseable | Ingestion API, schema-free design, high throughput | Cloud-based, rapid ingestion and retrieval | Newer tool with evolving features | Cloud-based applications |
| Log Owl | Error tracking, self-hosted, privacy-focused | Detailed analytics, user privacy | Limited to error tracking | Privacy-conscious developers |
If you enjoyed this roundup of the most popular open-source log management tools then why read our previous guide on log management tools or Prometheus?