
Resources
10 min read
When focusing on application performance monitoring (APM), there are currently many options to select from. With many of the tools available offering similar features, it can often be challenging to make an informed decision. One tool that appears to be on almost every list of ‘the best APM tools’ is Datadog.
Datadog’s application performance monitoring service (APM) allows users to detect, troubleshoot, and optimize performance issues in complex cloud-scale applications, has become an industry leader. But, not all users are satisfied with their product and are looking for alternatives. In this article, we will provide a number of suitable alternatives for your consideration.
Contents
What is APM?
Before analyzing issues surrounding Datadog application performance monitoring (APM) and APM alternatives, it’s important to establish a firm grasp of APM. APM is a set of practices and tools used to monitor and manage the performance of software applications.
Practitioners use APM to ensure system availability, optimize service performance and response times, and improve user experiences. Without APM tools, teams would likely struggle to resolve the numerous problems that can arise. Which would raise the likelihood of customers becoming frustrated by the poor user experience and abandoning the app altogether.
Application performance monitoring (APM) key features:
- Real-time monitoring: APM tools continuously monitor various metrics related to application performance, such as response times, transaction throughput, error rates, and resource utilization (CPU, memory, etc.).
- Endpoint monitoring: understand how mobile applications impact endpoint devices and identify issues with those devices.
- Transaction tracing: Transaction tracing allows the monitoring system to follow a specific user request or transaction through various application infrastructure components.
- Integration and automation: integrate service management tools and third-party sources to keep pace with an expanding and evolving infrastructure.
- Code-level insights: Advanced APM solutions provide visibility into the application's code, allowing developers to analyze the execution flow and identify specific areas causing performance issues. This deep insight is crucial for debugging and optimizing the application's code.
Datadog Application Performance Monitoring
Datadogs APM tool is a favourite among many developers and ops engineers. However, there are many users remain unsatisfied with the product due to issues such as affordability and lack of support. Many reviews state that the setup is difficult and when they reach out for support from Datadog, this is found to be lacking.
Another reasonably common negative review that arises for Datadog surrounds their pricing. A significant issue is that compared to other tools on the market, it’s one of the most expensive and due to the pricing model, it’s easy for it to become expensive quickly so much so that it may not scale with enterprise operations and their budget respectively. A specific example of this is from a customer that ‘accidentally left an ephemeral port attached to an IP address in the stream.’ Which increased their bill by $10,000 per month.
Datadog APM Alternatives
When it comes to APM, there are multiple options available for your organization, but determining which of these is the most appropriate and cost-effective can be difficult. So, to assist you, we’ve compiled a list of the top 10 Datadog APM Alternatives.
Logit.io
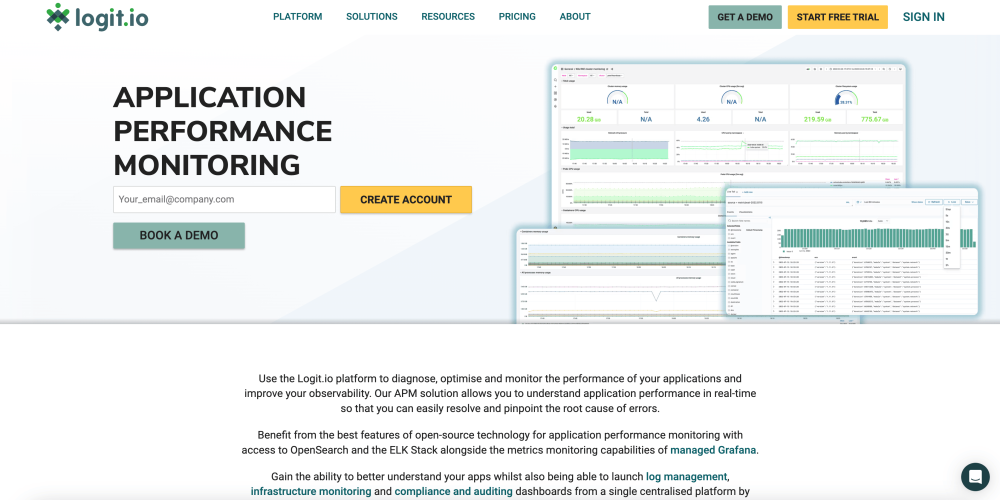 Logit.io platform offers fully open APM and trace analytics without vendor lock-in, or data egress fees, and displays transparent easy to understand billing. Logit.io allows application developers to install code faster by spending less time on manual analysis of distributed logs, traces, and metrics. The platform also improves testing quality for QAs that need to identify application bottlenecks and perform load testing across various components.
Logit.io is significantly more cost-effective than many other management and application performance monitoring platforms and can provide a highly suitable alternative to Datadog. This means that you can log all your data without compromise. Also, with economical highly available SLAs and 20% off any annual subscription, you can make the switch towards full observability and scalability with ease, affordably.
Features:
- Highly rated specialist support and zero vendor lock-in.
- Node metrics visualization and event drill-down.
- Analyse hybrid-cloud environments, application performance metrics, and alert on your infrastructure within one platform.
- View latency by service.
Request a Demo
Want to learn more about Logit.io's powerful observability platform? Book a demo and we'll walk you through the extensive capabilities and discuss your requirements in detail.
Dynatrace
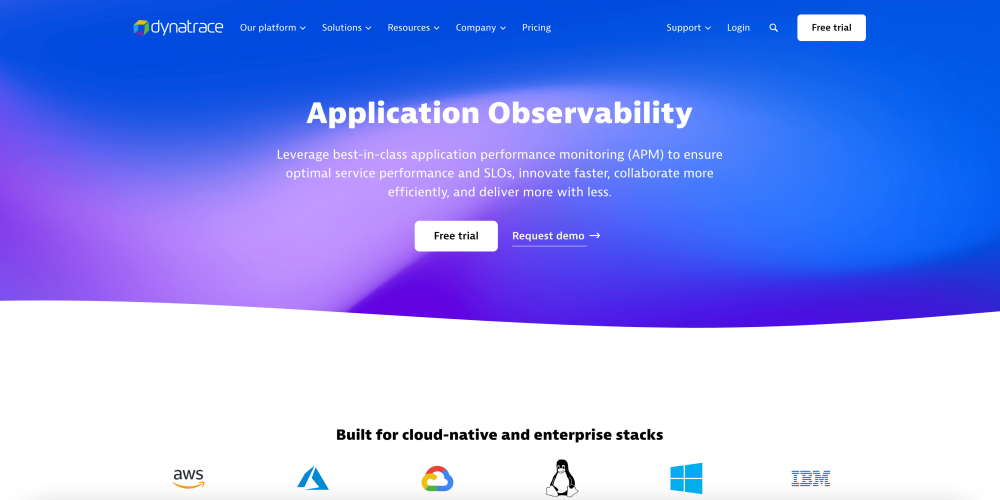 Dynatrace is an observability platform available as a cloud-based SaaS or an on-premises service with advanced APM capabilities. Through the use of the agent, it provides auto-generated topology visualizations of applications and their elements. This sets Dynatrace apart as an application performance tool.
Features:
- Monitor containers, VMs, server-side services, mobile apps and cloud environments.
- Visualises application topology, deployments and environment changes in real time.
- Gain insights into the DevOps pipeline for every build and deployment, and detect and monitor SQL and NoSQL databases.
- Envisage the entire application topology in an interactive infographic.
New Relic APM
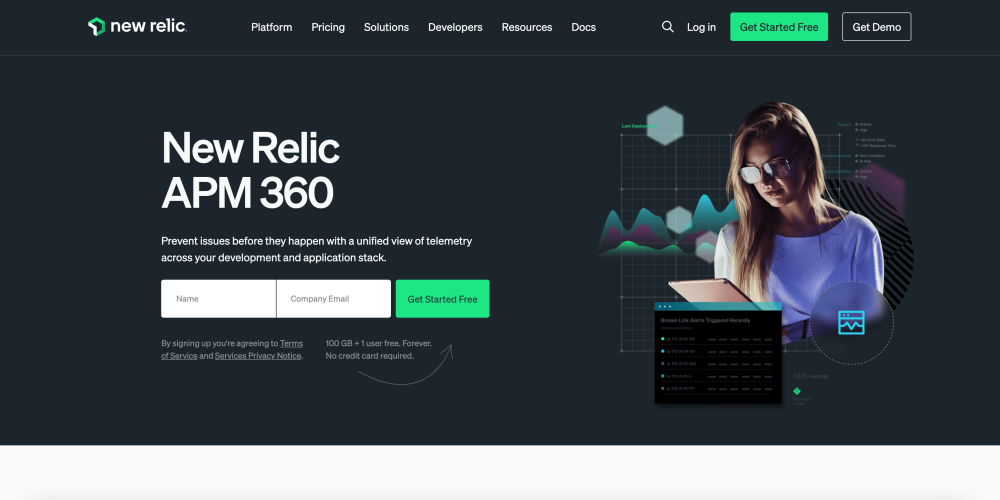 New Relic is one of the industry leaders in application performance management. Potentially the most significant feature is the extremely vivid visualization it offers of the entire stack. Also, New Relic has another unique feature, WordPress-specific functionality. This works by, when you set up New Relic on a WordPress site, it opens up several new monitoring features that let you easily keep tabs on WordPress hooks, plugins, and themes.
Features:
- Diagnose incidents flowing through interconnected services by utilizing the automap feature.
- WordPress-specific functionality.
- Monitor critical business transactions independent of the application.
- A free version is available, however, it has significant limitations.
AppDynamics
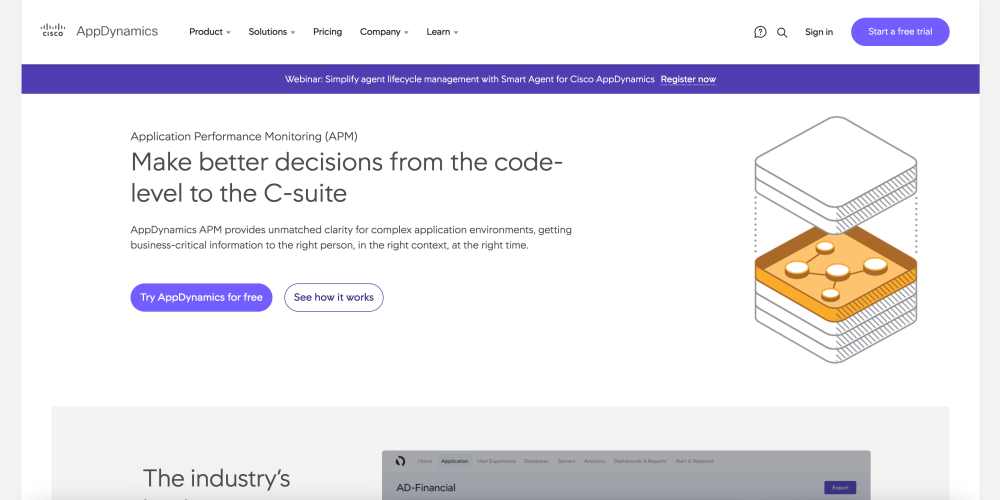 AppDynamics is a full-stack observability platform that incorporates extensive APM capabilities that can centralize and correlate performance analytics across the full application stack. They tend to cater to larger enterprises and offer both a SaaS APM option as well as an on-premise option.
Features:
- End-to-end transaction tracing.
- Automatically uncover how application components work together as well as application topology.
- Dynamic baselining and alerting.
- Troubleshoot application errors and slow response times.
Instana
 Instana is a performance monitoring tool backed by IBM. It is a full-stack context, which recognizes the association of services, calls, applications, and traces with infrastructure, logs, orchestration, and multiple others. The requests are tracked, analyzed, and stored with no sampling.
Features:
- Analyze traces and calls in real-time machine learning and identify anomalous requests.
- Discover and map all services and application dependencies.
- Visualize cause-and-effect reports that connect to more in-depth data.
- Supports Java, .NET, Node.js, Go, and more.
Raygun
 Raygun APM is a performance monitoring platform, SaaS server-side, that provides both real-time and trend applications as well as user experience data performance. Raygun has the ability to identify authenticated users, so you get a view of which specific users encountered problems, and to what extent. The platform supports Ruby, Node.js and .NET software applications.
Features:
- Construct custom rules for the detection of issues once performance thresholds are reached.
- Track multiple applications using any language and framework.
- Implement code filtering to remove undesired method captures and URLs.
- Visualize performance data in charts and reports to highlight real-time issues.
Sematext
 Sematext APM provides web application performance by tracking individual and business transactions in real-time end-to-end visibility to detect the slowest and under-performance parts of your application. The service also verifies how applications interact with underlying components, databases, and external services.
Features:
- Capability to monitor & filter database functions and slow SQL to distinguish the most time-consuming transactions.
- Real-time alerting assists discovery of anomalies before they can affect the end user.
- Acquire code-level visibility to distinguish root causes for performance problems and reduce MTTR.
- Supported languages: PHP, Python, Perl, Java, GoLang, and others.
ManageEngine Applications Manager
 ManageEngine Applications Manager includes applications running precisely on the production servers, on cloud servers, and over virtualizations. The platform provides deep performance insight into business-critical applications, both within the data centre and on the cloud. It is easy to use and can be set up in minutes. This system may supplement the OpManager network monitoring package due to both systems meeting at server monitoring, giving a full stack view.
Features:
- Substantially monitor virtual, hybrid cloud, and container technologies like Kubernetes and Docker.
- Foresee future resource utilization and expansion with machine learning-enabled analytics.
- Immediate support for well over a hundred applications and infrastructure elements.
Stackify Retrace
 Stackify Retrace detects bugs and bottlenecks and then delivers alerts to a channel of choice such as Slack via their APM platform or SMS. The service also identifies application performance issues using code-level performance traces and maintains the health of various servers and applications.
Features:
- Draws all the logs into a centralized location, making them much simpler to analyze.
- A SaaS-based APM tool that’s formulated specifically for developers.
- Retrace preserves the health of many applications and servers.
- Can be combined with other tools and supports multiple environments.
Groundcover
 With Groundcovers APM solution you can attain end-to-end observability into your applications performance, and highlight and rectify issues quickly with no code changes. The platform utilizes eBPF instrumentation to collect data across your entire stack, and can be installed in seconds to gain 100% coverage into application metrics and traces.
Features
- Deploy in seconds and cover your entire stack using the power of eBPF.
- Simple query builder to search and filter traces instantly
- Live network dependency maps
- Automatically identifies application issues and aggregates them into actionable insights.
Catchpoint
 The catchpoint platform provides you with actionable insights and visibility into your entire digital ecosystem. Catchpoint boasts that their application experience solution goes beyond traditional APM by combining API monitoring, Full DevOps Lifecycle Support, and Cloud Application Monitoring with traditional APM.
Features:
- Monitor cloud applications from the same distributed locations as your users
- Continuously enhance API performance and uptime with API health monitoring
- Guarantee resilience across all stages of your DevOps lifecycle to maintain business innovation velocity
- Detect and troubleshoot application performance issues
Zenoss
 Zenoss offers application monitoring for your dynamic environment. Zenoss do not offer complete health monitoring of your applications, instead they offer monitoring for 85-95% of your applications, but their price reflects this making it a cost-effective solution.
Features:
- Monitoring for collaboration and unified communications tools
- Actionable intelligence for log, netflow, and machine data
- Full-stack insights for application servers
- Database monitoring tailored to the features of each platform
Densify
 Densify aims to drive efficiency without compromising application performance by offering a solution that allows you to control and enhance the resources powering your apps. Densify differs from the traditional APM tools by solely focusing on optimizing resource utilization to improve the efficiency of your appliations.
Features:
- Seamless integration into your existing processes
- Algorithms automatically optimize Kubernetes container requests and limits, node configurations and scaling
- Automatically select the configuration, size, type and family for your public cloud instances and scale groups
- Utilizies the industries most sophisticated algorithms.
LiveAction
 By utilizing LiveAction's network infrastructure, policies, and protocol insights you can create an enhanced user experience across all your business-critical applications. LiveAction provides root cause analysis by offering complete visibility into infrastructure and transport context from numerous data sources.
Features:
- Reduces overall network latency
- Customisable dashboards and alerts for real-time analysis
- Consolidate tools making data silos redundant
- Optimize voice and video performance
Pulseway
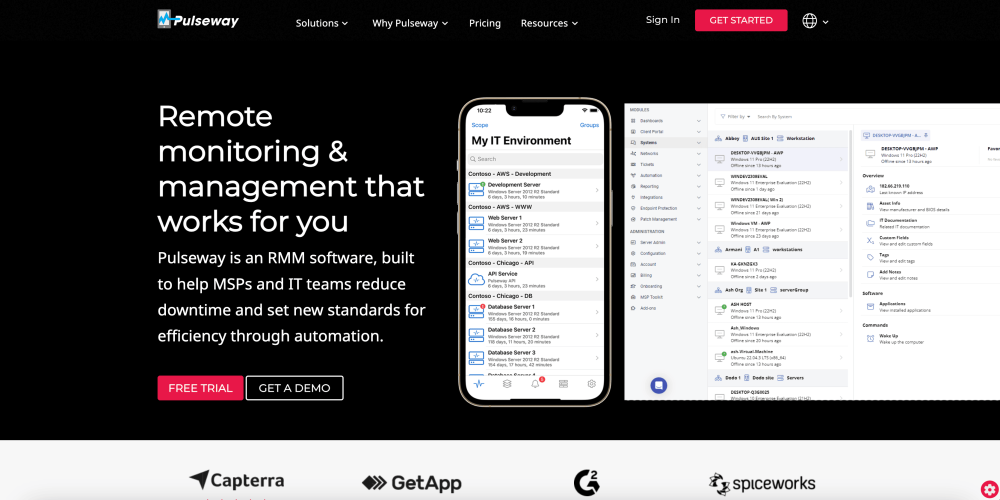 Pulseway offers real-time IT management software, stating that powerful does not need to be complicated. The solutions enables organizations to monitor, manage, and troubleshoot workstations, servers, and network devices across their entire IT environment.
Features:
- Integrates with leading software solutions
- Report in detail with 28 advanced templates
- Network Discovery and Deployment engine allows instant productivity almost instantly
- Automation and auto-remediation
Stagemonitor
 Stagemonitor is an open-source APM tool for Java server applications. This platform enables you to monitor the performance of your Java web app throughout its lifecycle in development, QA, and production. The tool’s outstanding attribute is the browser widget that allows you to observe and collect analytics while you’re advancing the application.
Features:
- Stagemonitor is free and open-source software.
- It integrates well with time-series databases like ElasticSearch, Graphite, and InfluxDB.
- Preconfigured dashboards.
- Development-time monitoring.
If you found this article to be informative then why not read about traces and spans or container monitoring tools next?