
How To Guides, Security
11 min read
Last updated:
Contents
- Apache Log4j Vulnerability Guidance
- What Is CVE-2021-44228 & CVE-2021-45046?
- How can I identify if I have been or might be compromised by the Log4j vulnerability?
- How To Install Filebeat
- How To Install Auditbeat
- Configuring Alerts and Notifications
- Mitigating CVE-2021-44228
- Reaching out for Help and Further Support
Apache Log4j Vulnerability Guidance
If you've already heard about the Apache Log4j CVE-2021-44228 (also known as Log4Shell and formally LogJam) vulnerability then you will know that this is a significant issue as many organisations are scrambling to secure their infrastructure from this critical remote code execution (RCE) vulnerability.
With these considerations in mind, we wanted to bring you a guide that outlines the steps that can be followed to ensure the security of your systems from CVE-2021-44228.
What Is CVE-2021-44228 & CVE-2021-45046?
CVE-2021-44228 is a remote code execution vulnerability that affects numerous versions of the Apache Log4j library. This vulnerability is so critical as CVE-2021-44228 allows threat actors to take full control of servers without any authentication required. In terms of severity, Log4Shell is rated a 10 out of 10 level vulnerability.
CVE-2021-45046 is a more recently discovered vulnerability in connection to CVE-2021-44228 which was raised due to the previous fix not working in certain non-default configurations.
Because of this vulnerability, attackers need only to trigger a log event that contains a malicious string (specifically a Java Naming and Directory Interface URL) that is then automatically logged and opened by Log4j.
Versions 2.0 and 2.14.1 of Log4j have both been affected while Java Development Kit (JDK) versions 6u211, 7u201, 8u191 and 11.0.1 have not been affected (according to LunaSec).
Some users may have concerns that Log4j version 1.x is affected by the vulnerability. Fortunately, this is not the case as this deployment of Log4J does not offer a JNDI lookup mechanism at the message level.
Unless you happen to have JMSAppender enabled in the configuration file (this will trigger a JNDI lookup in this event) your version shouldn't be vulnerable to attack.
As Java logging libraries are so widely used by companies such as Minecraft, Uber, Airbnb and Pinterest as well as over 9937 other companies (according to Stackshare) there are going to be many applications that are currently vulnerable to CVE-2021-44228.
A list containing many of the companies that have potentially been affected by the Log4Shell vulnerability can be found here. This resource includes more details on which of these organisations have launched fixes, workarounds and which have the status of "not vulnerable" for anyone concerned.
How can I identify if I have been or might be compromised by the Log4j vulnerability?
By using an observability focused tool such as Logit.io you can take the first steps necessary to analyse your system logs to identify the signs of a potential Log4j security breach.
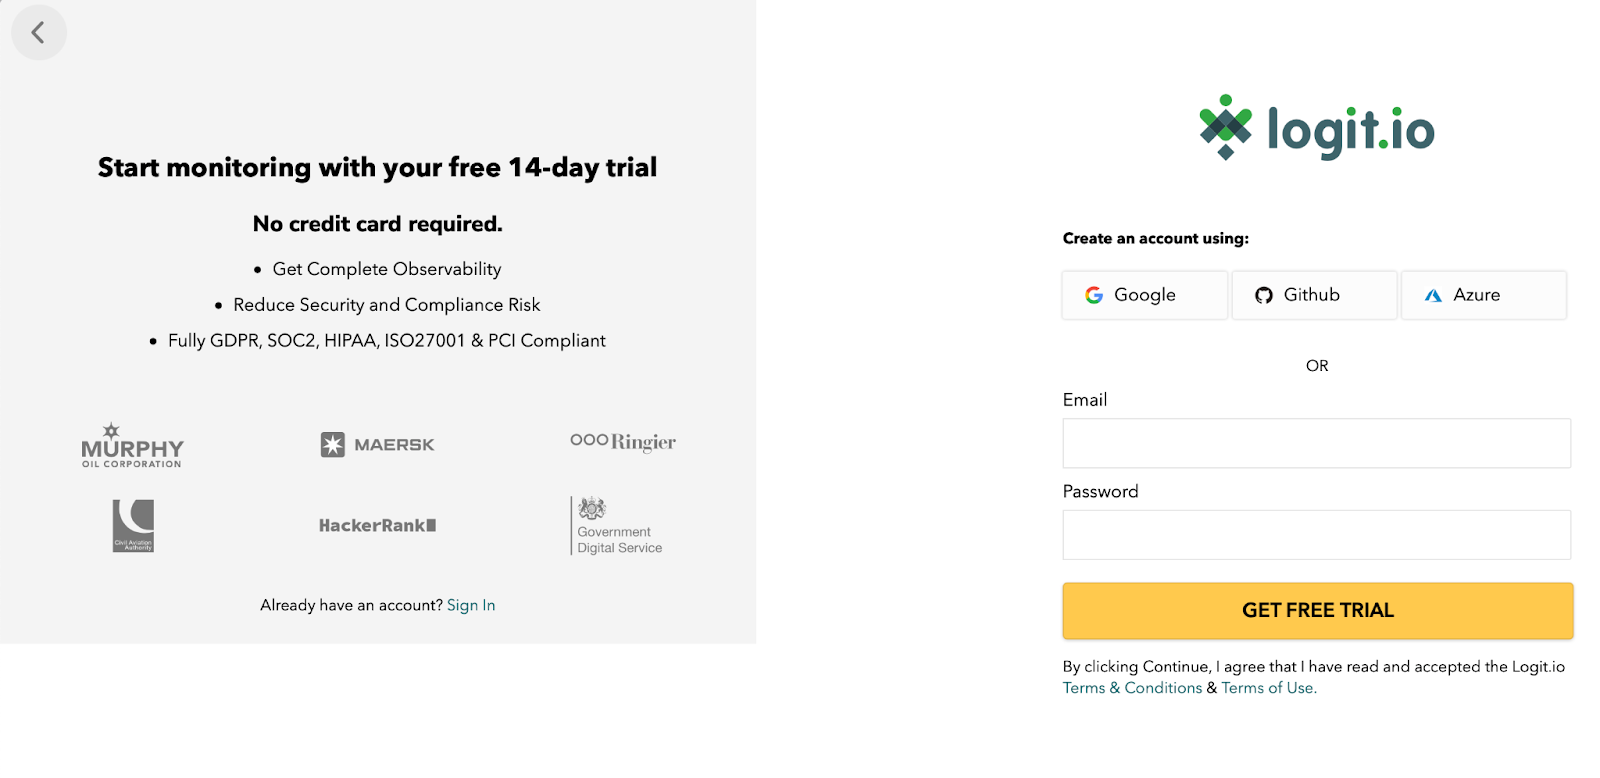
To get complete observability of your infrastructure, start monitoring today with your free 14-day trial. To sign up simply choose to sign up with Google, Github or Azure, or choose a new email and password to sign up with.
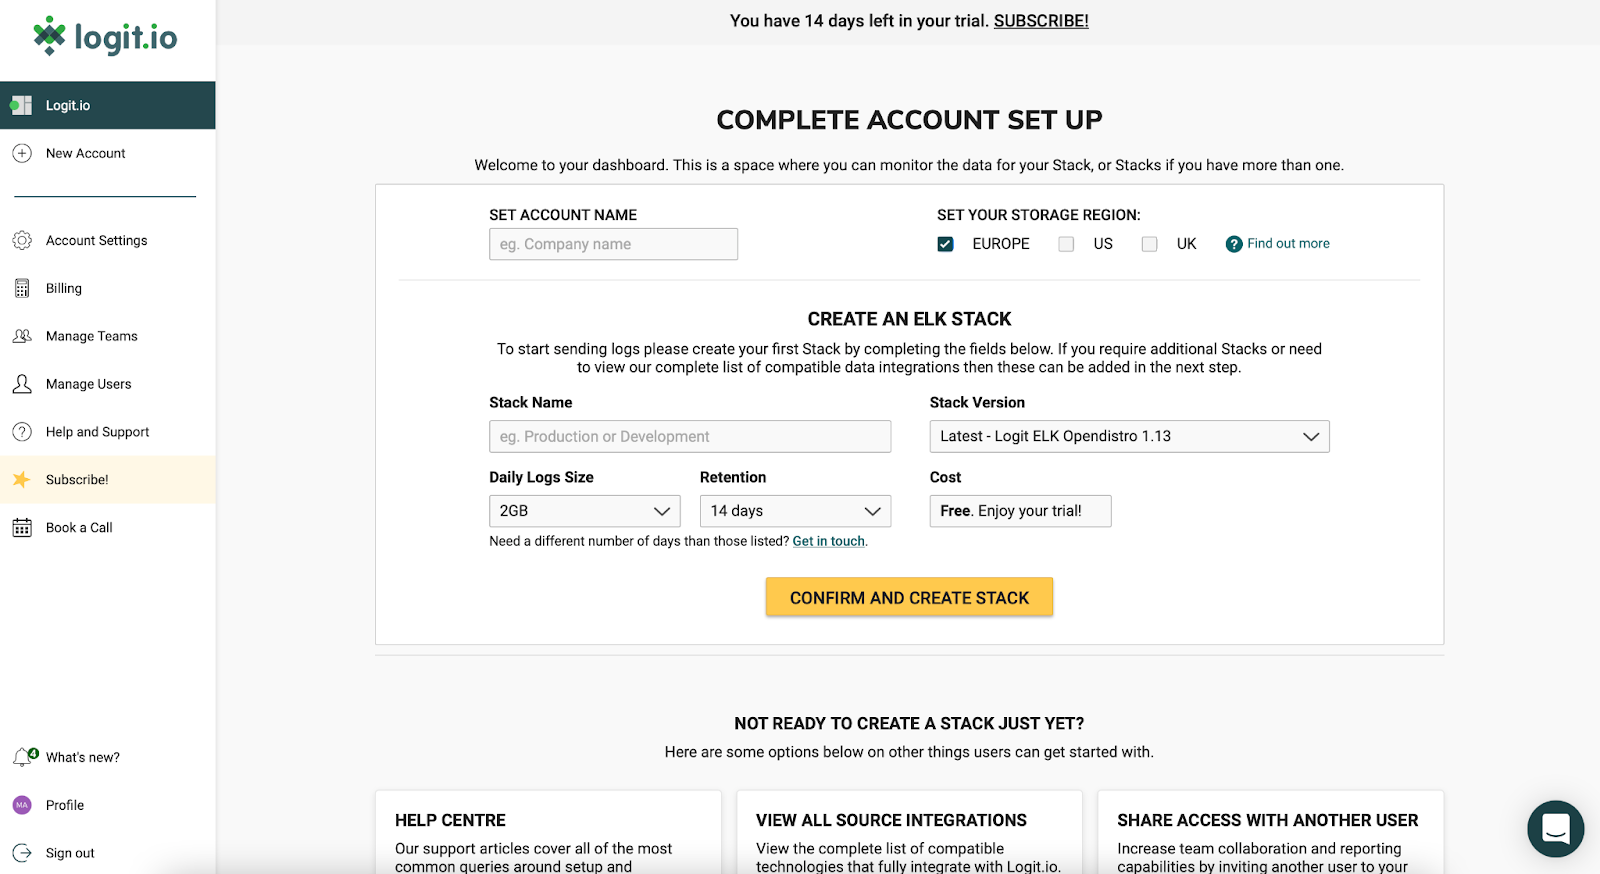
On the next screen, you will be able to set your account name and select a region for where you would like your data to be stored. If you have no preference we recommend leaving this set to Europe.
Next, enter a name for your Stack, for example, this could be Observability Stack or Security Monitoring. The name of your Stack can always be changed at a later date by choosing “View Stack Settings” from your dashboard. For our chosen technology Stack we will want to select the latest version of the Logit.io Stack - Logit ELK Opendistro 1.13.
You are now presented with your Logit.io dashboard from which you can send, configure, monitor and analyse the logs and metrics being sent to your Stack.
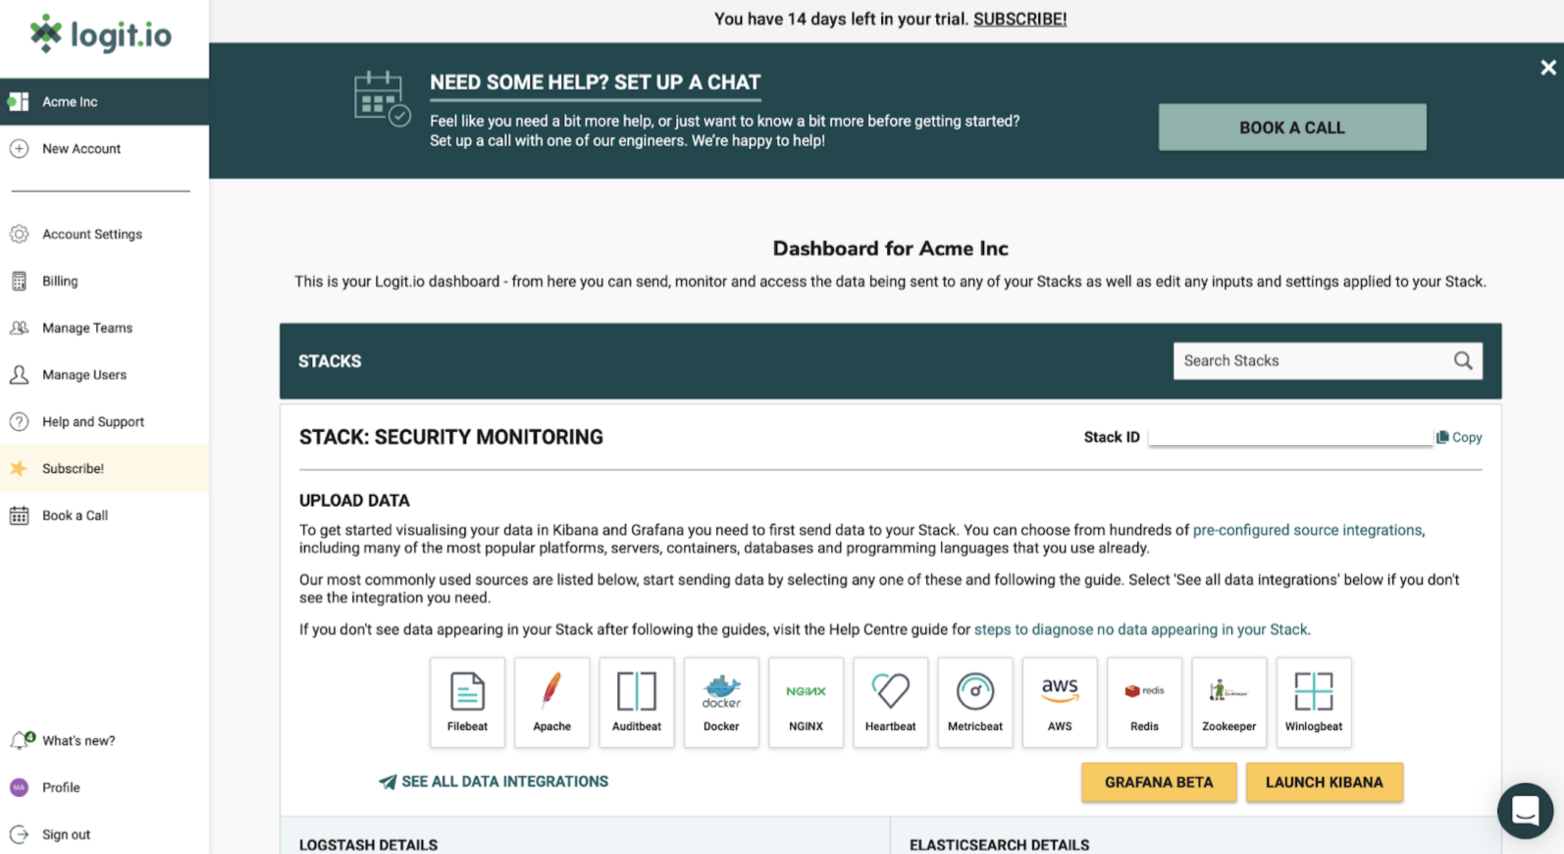
The first thing we need to do in order to detect Apache log4j vulnerabilities is to configure the shipping of your log files to your new Logit.io Stack. The easiest and most secure way to do this is to use a lightweight shipper called Filebeat.
We’ll then move on to configure Auditbeat which is similar to Filebeat but focuses on gathering audit data on user activity and processes running on your server’s infrastructure, you can read more about Auditbeat here.
How To Install Filebeat
Filebeat is one of the leading tools used for forwarding logs to the Elastic Stack due to its reliability. When Filebeat is used as part of the logging pipeline it can also generate and parse common logs to be indexed within Elasticsearch.
STEP 1 - INSTALL FILEBEAT
deb (Debian/Ubuntu/Mint)

curl -L -O https://artifacts.elastic.co/downloads/beats/filebeat/filebeat-oss-7.15.1-amd64.deb
sudo dpkg -i filebeat-oss-7.15.1-amd64.deb
For other operating systems and details on running Filebeat as a service visit the dedicated source integration page.
STEP 2 - LOCATE THE CONFIGURATION FILE
On Debian/rpm the configuration file can be found in /etc/filebeat/filebeat.yml
STEP 3 - CONFIGURE THE INPUTS OR LOG FILES THAT WE WANT TO MONITOR
Configure the file paths that you want to ship logs from. These fully support wildcards and can also include a document type. By default the enabled flag is set to false, we need to ensure this is set to true to begin shipping for this input.
The default filebeat.inputs section looks as below
filebeat.inputs:

- type: log

  # Change to true to enable this input configuration.
  enabled: true

  # Paths that should be crawled and fetched. Glob based paths.
  paths:
  - /var/log/*.log
STEP 4 - CONFIGURE WHERE TO SECURELY SHIP THE LOGS TO
We'll be shipping to Logstash on your Logit.io Stack so that we have the option to run filters before the data is indexed. In the configuration file replace the Elasticsearch output block:
## Comment out elasticsearch output
#output.elasticsearch:
#  hosts: ["localhost:9200"]
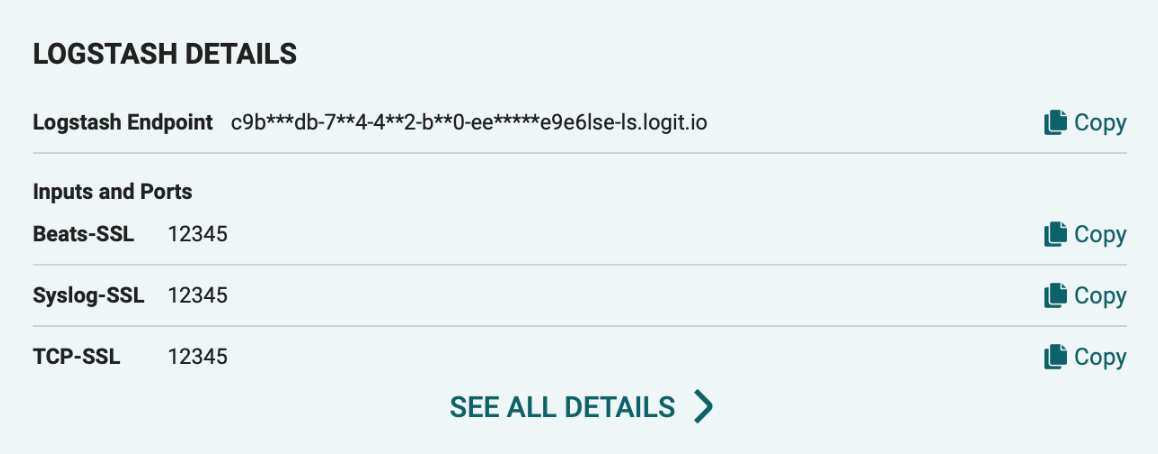
And replace it with your Logstash endpoint and Beats-SSL port, you can find these details on your Logit.io Stack dashboard mentioned earlier and shown in the screenshot below.
output.logstash: hosts: ["[YOURSTACKID]-ls.logit.io:[YOURSSLBEATSPORT]"] loadbalance: true ssl.enabled: true
STEP 6 - VALIDATE THE FILEBEAT CONFIGURATION
Let's check the configuration file is syntactically correct by running filebeat directly inside the terminal. If the file is invalid, filebeat will print an error loading config file error message with details on how to correct the problem.
deb/rpm

sudo filebeat -e -c /etc/filebeat/filebeat.yml
STEP 7 - START FILEBEAT
If there are no errors reported when you validate the configuration in step 6, we can now go ahead and start Filebeat.
deb/rpm

sudo systemctl enable filebeat
sudo systemctl start filebeat
If you don't see data appearing in your Stack after following the steps, visit the Help Centre guide for steps to diagnose no data appearing in your Stack help article or reach out to the Logit.io Engineers on live chat for further assistance.
How To Install Auditbeat
Auditbeat is a lightweight shipper that is used to collect audit data. Auditbeat can also be used to detect crucial and unexpected changes to configuration files & binaries which can prove vital for pinpointing the signs of security violations occurring within your organisation.
STEP 1 - INSTALL AUDITBEAT
deb (Debian/Ubuntu/Mint)

curl -L -O https://artifacts.elastic.co/downloads/beats/auditbeat/auditbeat-oss-7.15.1-amd64.deb
sudo dpkg -i auditbeat-oss-7.15.1-amd64.deb
For other operating systems and details on running Auditbeat as a service visit the source integration page.
STEP 2 - CONFIGURE MODULES
Locate and open the Auditbeat configuration file:
deb/rpm (Debian/Ubuntu/Mint/CentOS/RHEL/Fedora):

/etc/auditbeat/auditbeat.yml
By default, the file_integrity module will be enabled. This module watches for file changes such as when a file is created, updated or deleted. When a change is detected, Auditbeat will send events containing metadata to one or more configured output sources (e.g. Logstash).
The module can be configured in auditbeat.yml by adding or removing path addresses. Auditbeat will watch for changes in files relative to these paths.
There is also a full example configuration file called auditbeat.reference.yml that shows all the possible options.
STEP 3 - CONFIGURE WHERE TO SECURELY SHIP THE LOGS TO
Just like we shipped our logs using Filebeat above, we'll be shipping from Auditbeat to Logstash on your Logit.io Stack, so that we have the option to run filters before the data is indexed. In the configuration file replace the Elasticsearch output block:
## Comment out elasticsearch output
#output.elasticsearch:
#  hosts: ["localhost:9200"]
And replace it with your Logstash endpoint and Beats-SSL port, you can find these details on your Logit.io Stack dashboard mentioned earlier.
output.logstash:
hosts: ["[YOURSTACKID]-ls.logit.io:[YOURSSLBEATSPORT]"] loadbalance: true ssl.enabled: true
STEP 4 - VALIDATE THE AUDITBEAT CONFIGURATION
As we did for Filebeat, let's check if the configuration file is syntactically correct by running Auditbeat directly inside the terminal. If the file is invalid, Auditbeat will print an error loading config file error message with details on how to correct the problem.
deb/rpm

sudo auditbeat -e -c /etc/auditbeat/auditbeat.yml
STEP 5 - START AUDITBEAT
If there are no errors reported when you validate the configuration in step 4, we can now go ahead and start Filebeat.
deb/rpm

sudo systemctl enable auditbeat
sudo systemctl start auditbeat
If you don't see data appearing in your Stack after following these steps then you can visit the same article linked at the end of the Filebeat installation steps to help you diagnose data not appearing in your Stack.
Configuring Alerts and Notifications
Proactive security alerting is critical for detecting Apache log4j vulnerabilities and it is vital that we configure your alerts so that you get notified when someone is trying to gain unauthorised access to your systems. Not only does this protect your organisation and ensure you stay compliant, but it helps everyone to sleep easy at night.
As Log4Shell is a zero-day vulnerability that is evolving rapidly, it is vital to enable alerting on your Stack to make sure that you are notified proactively when spikes of certain events and other signs of malicious activity are logged by our system.
To get started configuring an alert to detect possible vulnerabilities on your newly created Stack choose “View Stack Settings” and then select “Alerting & Notifications”.
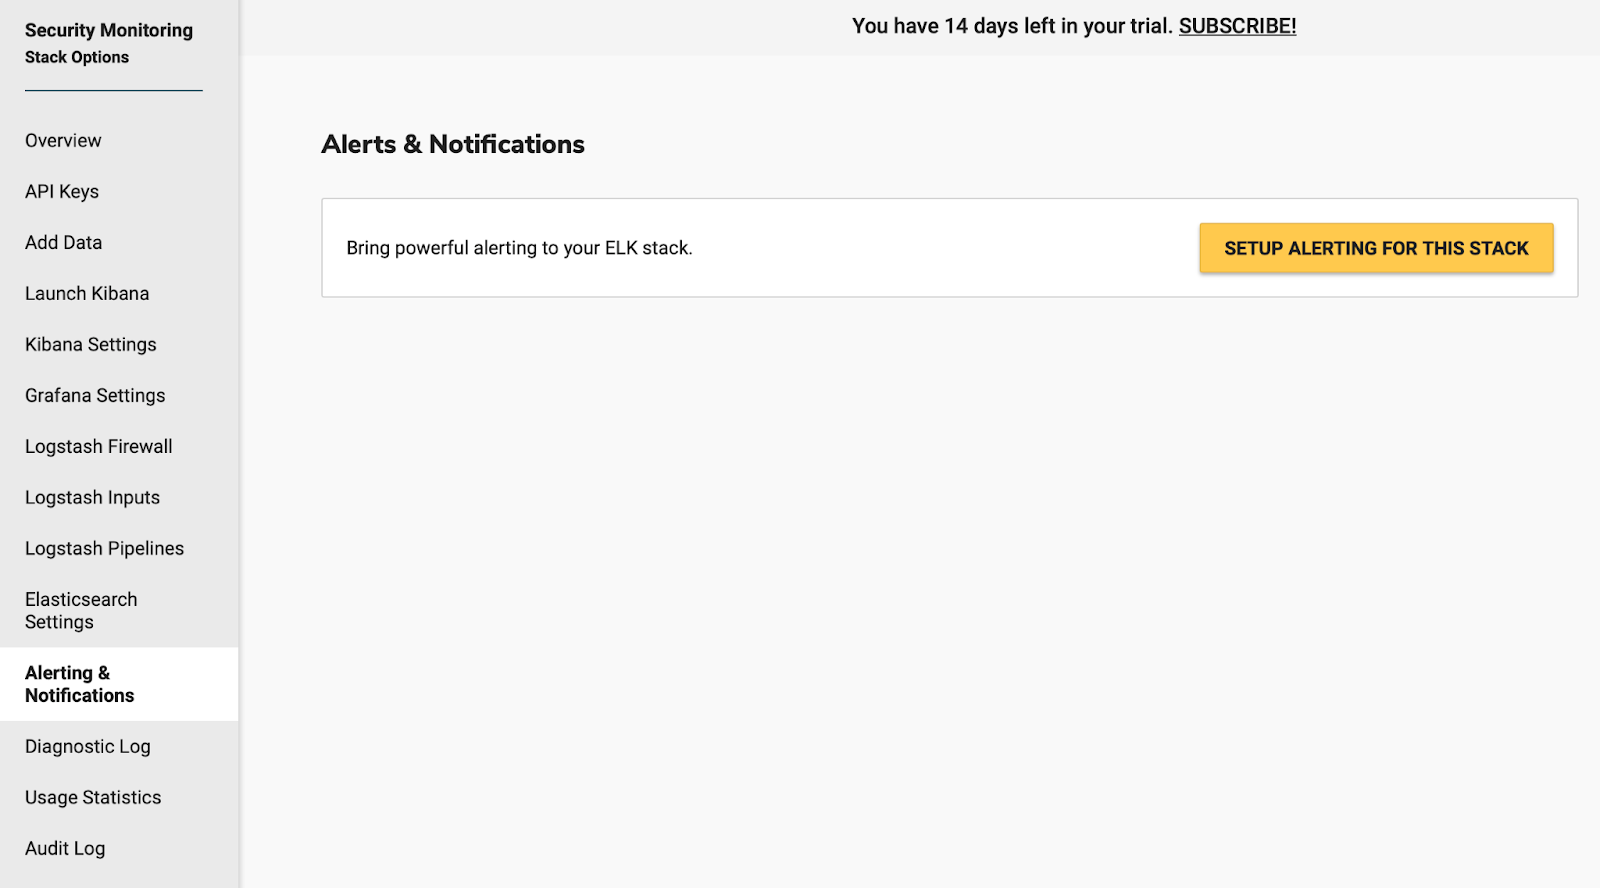
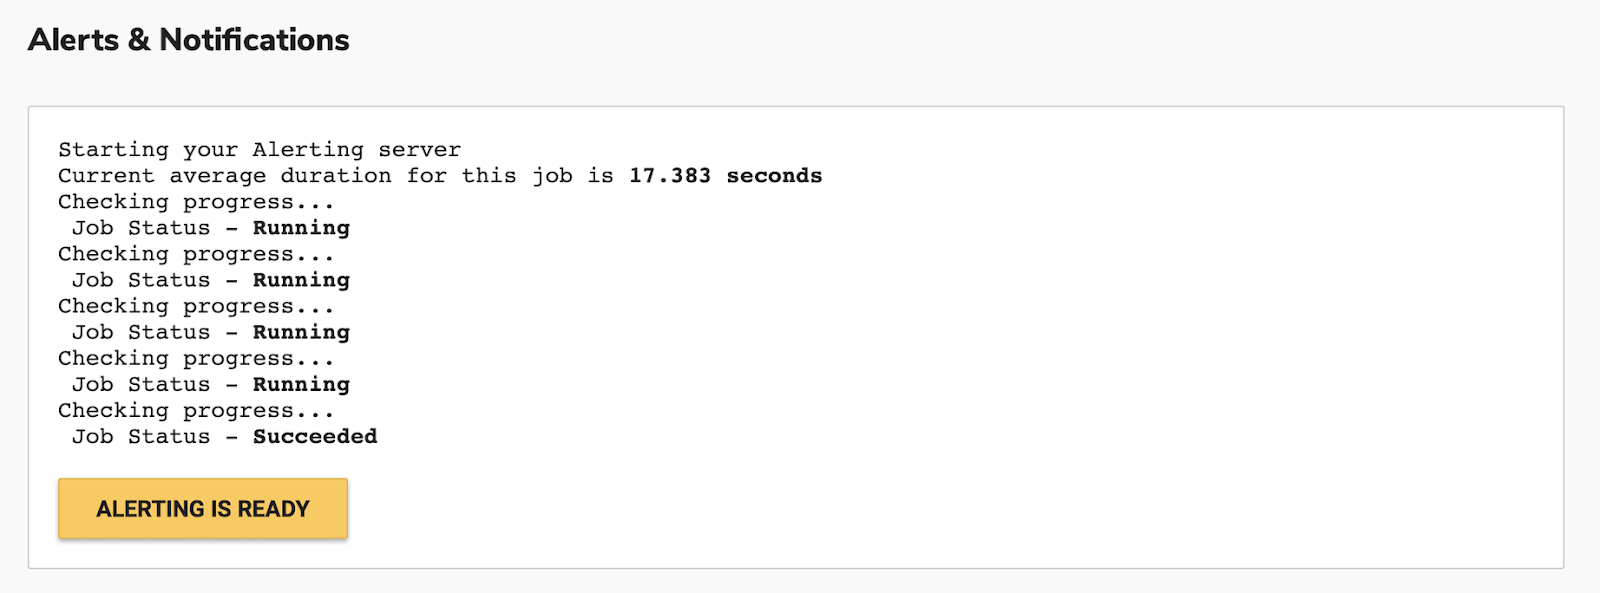
After choosing to “SETUP ALERTING FOR THIS STACK”, your alerting server instance will be provisioned, from here you can then select the “ALERTING IS READY” button to get started.
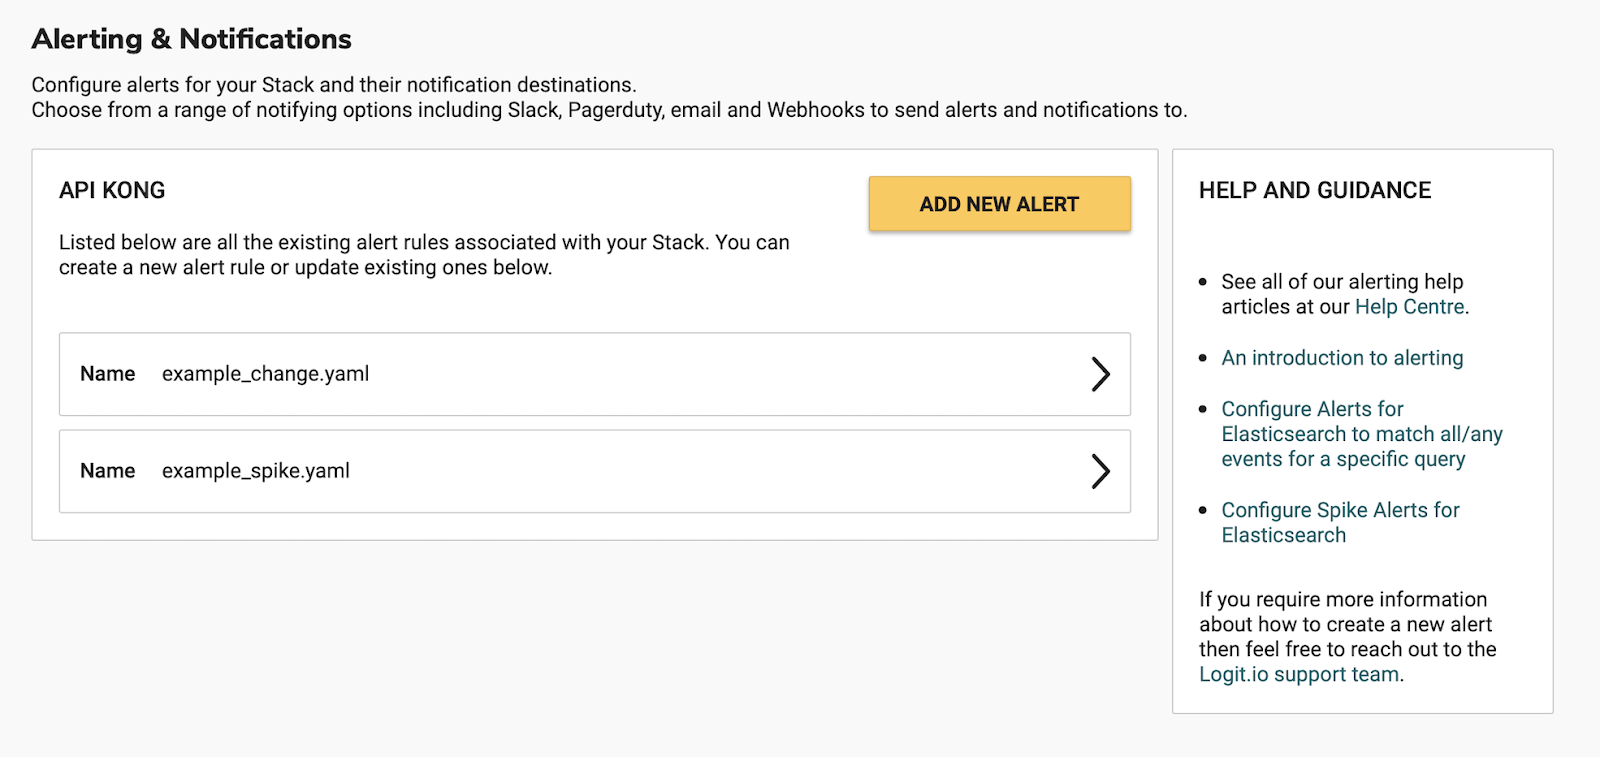
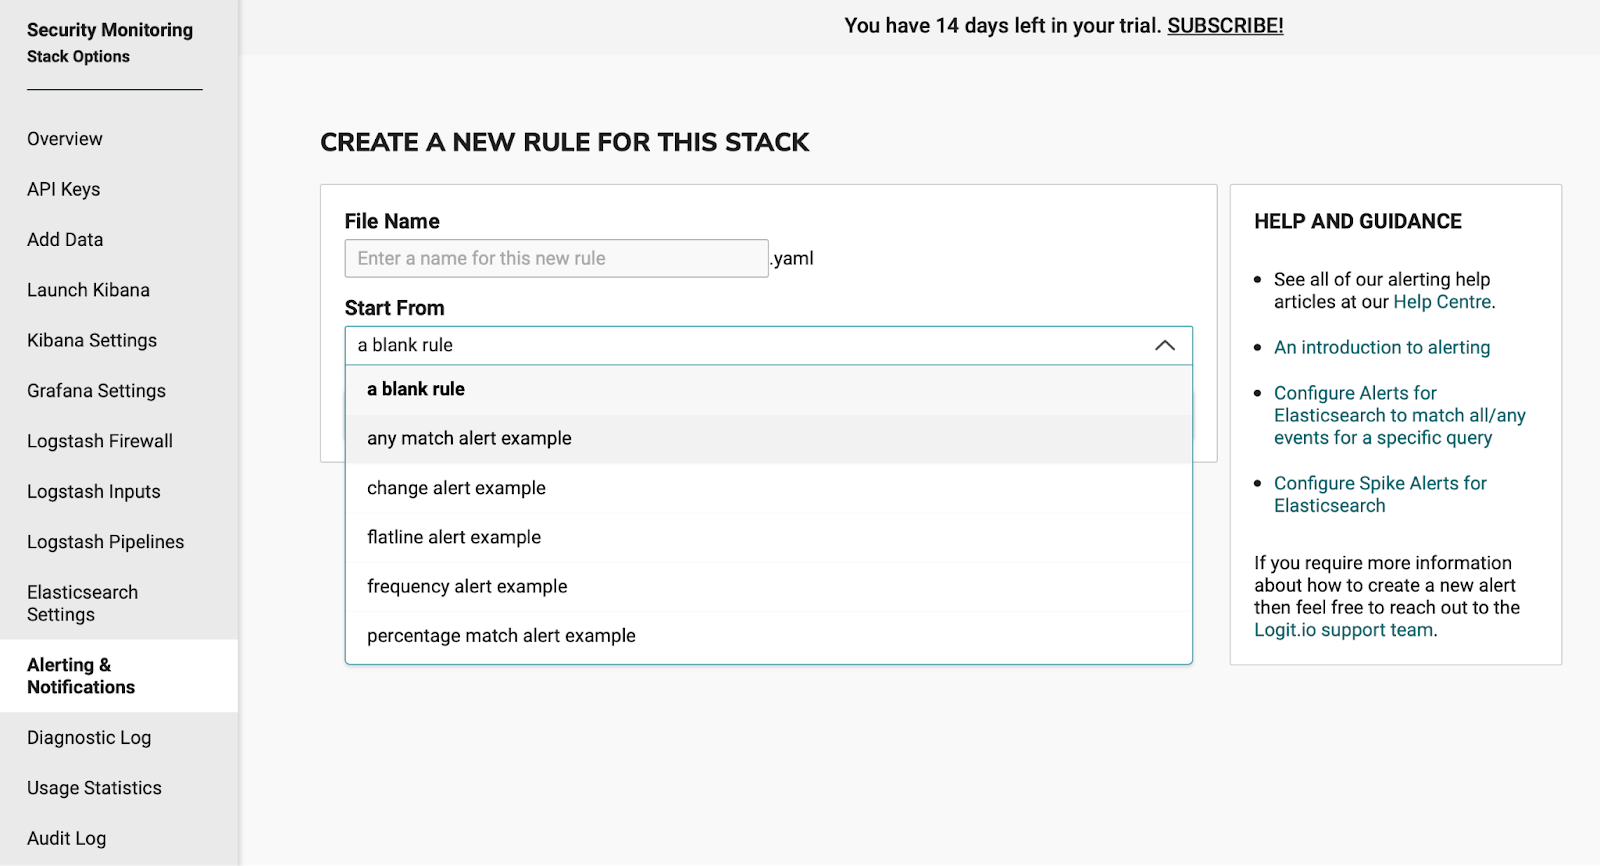
Choose “ADD NEW ALERT” to create a new alerting rule, you can choose from a number of predefined templates.
For this alert, we’re going to use the Match Any Rule, so go ahead and choose that from the dropdown displayed.
Any Rule - Will match anything; every log that the query returns will generate an alert.
This takes you to the alert editor and pre-populates the editor with a Match Any Rule example shown below:
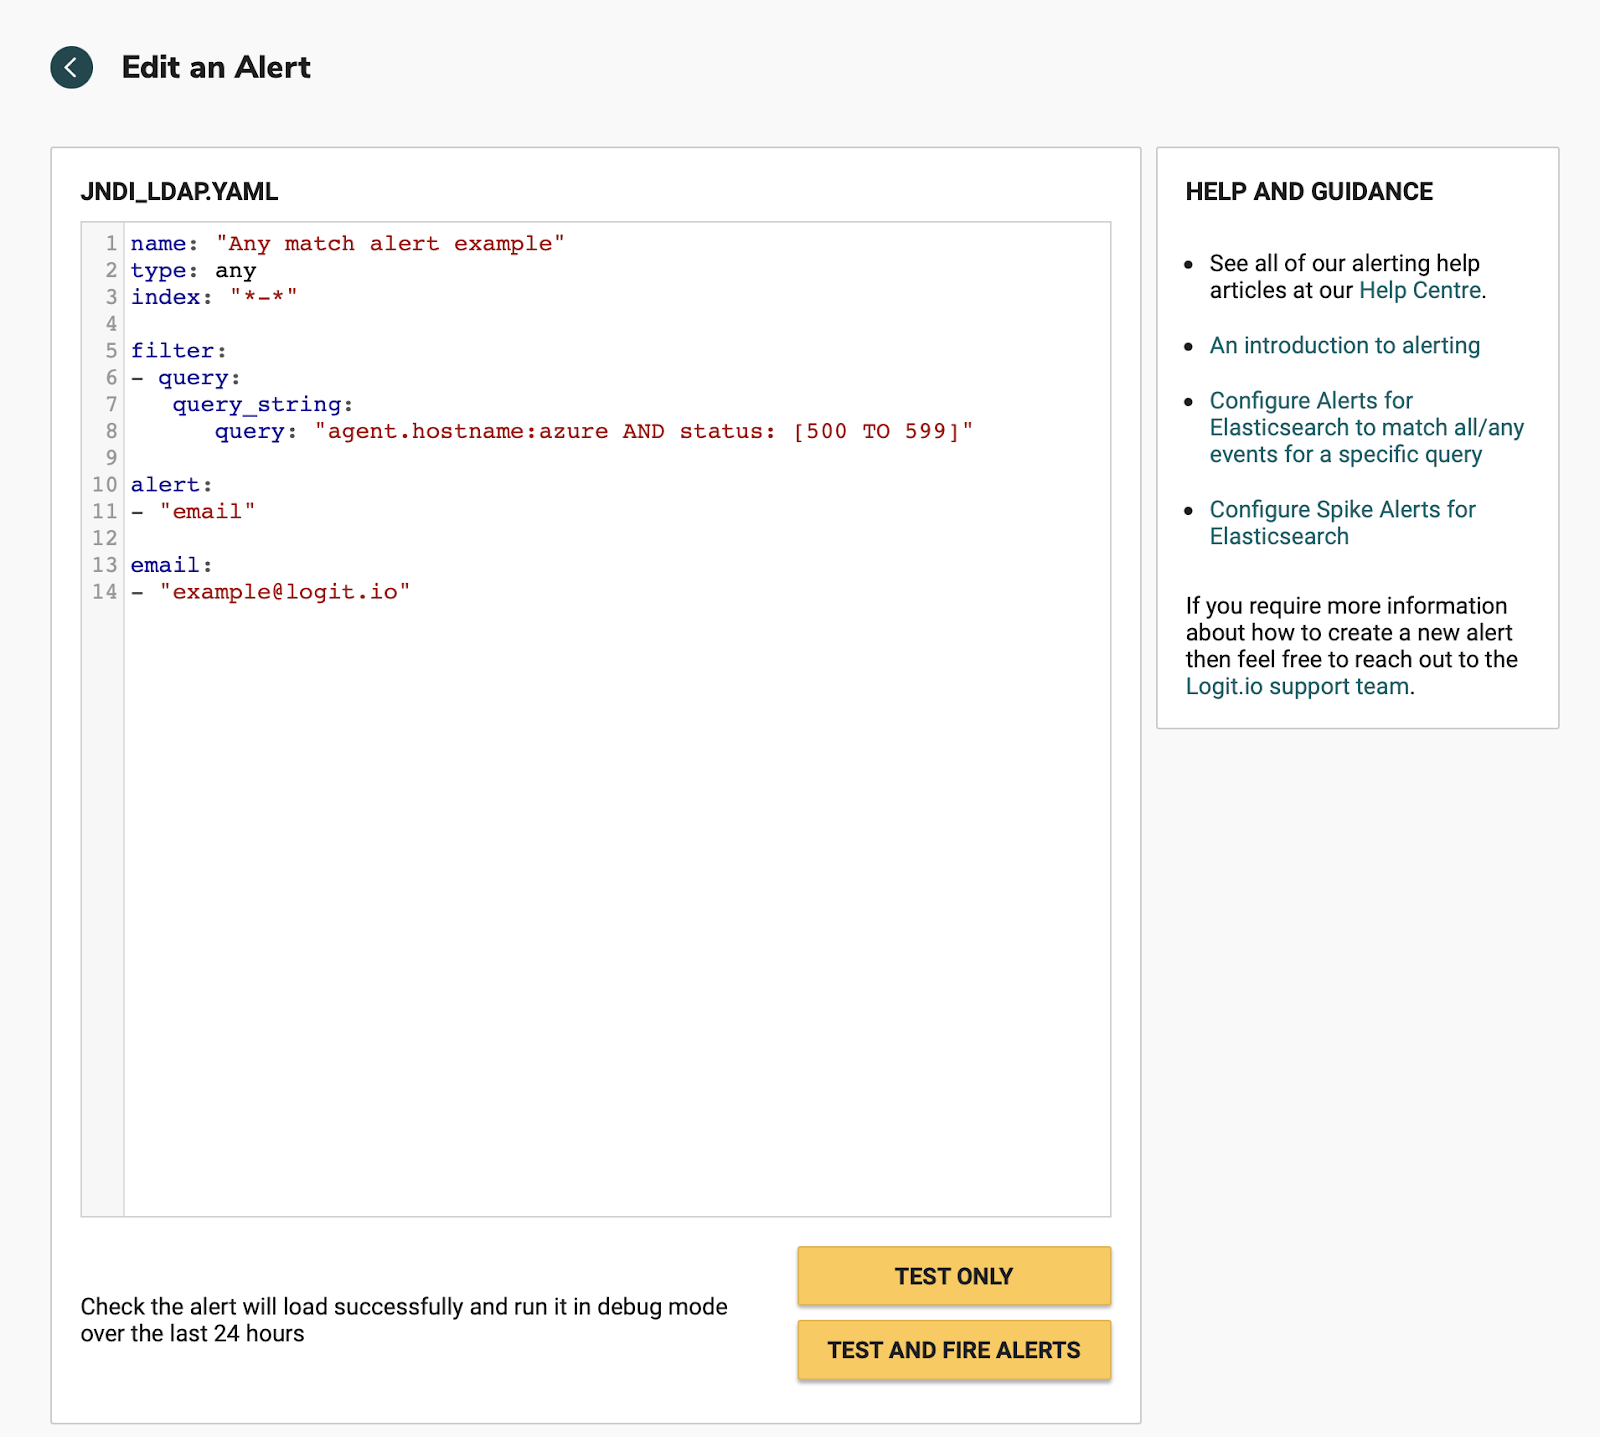
We need to replace this with the alert example below, as we’re going to send the alert to Slack, if you prefer to receive an email, then just leave the rule alert and email options as shown above.
We are going to search for the strings JNDI or ldap as attempts to execute a java based application may use JNDI and LDAP together to lookup data and invoke the command remotely and then can go on to read attributes from it, in vulnerable configurations.
Edit the query to read “JNDI OR LDAP” which will find all matches for both strings.
name: "JNDI or LDAP"
type: any
index: "*-*"

filter:
- query:
   query_string:
  query: "jndi OR ldap"

alert:
- "slack"

alert_text: "JNDI OR LDAP detected in monitoring logs"

slack_webhook_url:
- "ENTER YOUR SLACK WEBHOOK HERE"
Choose TEST ONLY to test the alert against your Stack logs for the past 24hrs. You should be able to see in the output if there have been any occurrences of the string matches in your logs.
Choose TEST AND FIRE ALERTS to run the alert and this time trigger the email or notification to slack, again this is just a test to make sure everything is working correctly. Once you are happy with the alert choose the APPLY CHANGES button to save the alert rule to your Stack.
To read more on Alerting on Logit.io take a look at these articles in the Help Centre.
Mitigating CVE-2021-44228
CVE-2021-44228 can largely be mitigated by setting system property "log4j2.formatMsgNoLookups" to “true” or by removing JndiLookup class from the classpath: zip -q -d log4j-core-*.jar org/apache/logging/log4j/core/lookup/JndiLookup.class.
CVE-2021-45046 is another more recently discovered vulnerability that was raised as a result of the previous solution not working in certain non-default configurations.
Upgrading to Log4j 2.17.0 or higher is another solution to remedy both CVEs as these later versions of Log4j disable JNDI functionality by default and remove support for Message Lookup patterns.
It is also advisable that you harden known vulnerable components, this may involve making sure that configuration files are only deployed with read-only permissions and if possible these components are also configured to trigger alerts if any unauthorised manipulation is detected.
Another point to consider is to implement WAF rules (like the type that CloudFlare has rolled out) to deny malicious attacks. This strategy isn't to be relied on entirely and is simply another way to further harden your security processes in response to Log4Shell.
Reaching out for Help and Further Support
We're here to help you get the setup that's right for you so that you can protect your infrastructure from vulnerabilities. Have questions or want to give us feedback? Feel free to reach out to a member of our support team via live chat or via [email protected].