Getting Started, How To Guides, ELK
4 min read
Last updated:
Contents
This article will help you diagnose issues with your Filebeat configuration file.
1. Check you have correctly set-up the inputs
First you are going to check that you have set the inputs for Filebeat to collect data from. Inputs are essentially the location you will be choosing to process logs and metrics from. The easiest way to do this is by enabling the modules that come installed with Filebeat.
Enabling Modules
Modules are the easiest way to get Filebeat to harvest data as they come preconfigured for the most common log formats. You can check the list of modules available to you by running the Filebeat modules list command. You will also notice the response tells us which modules are enabled or disabled.
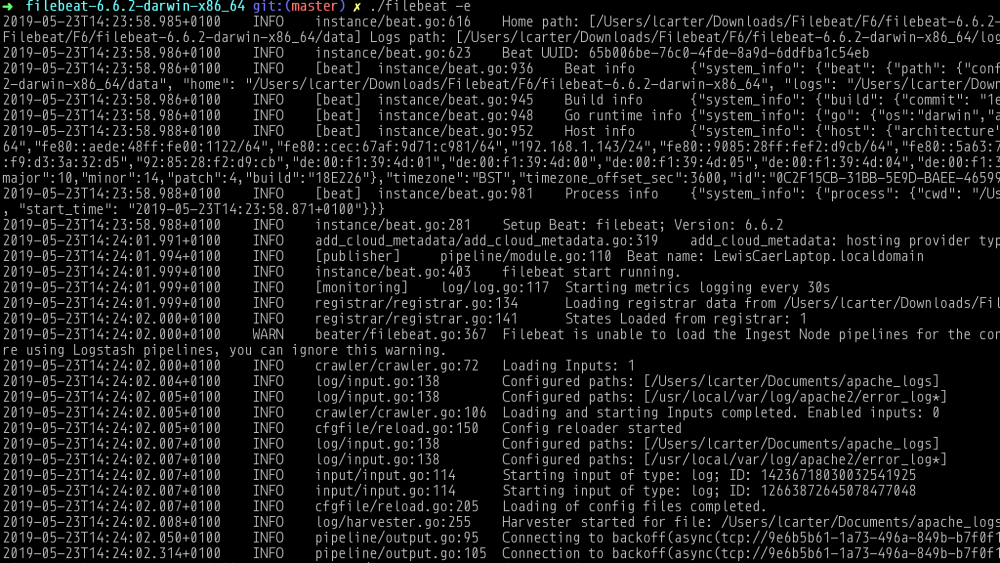
filebeat modules list
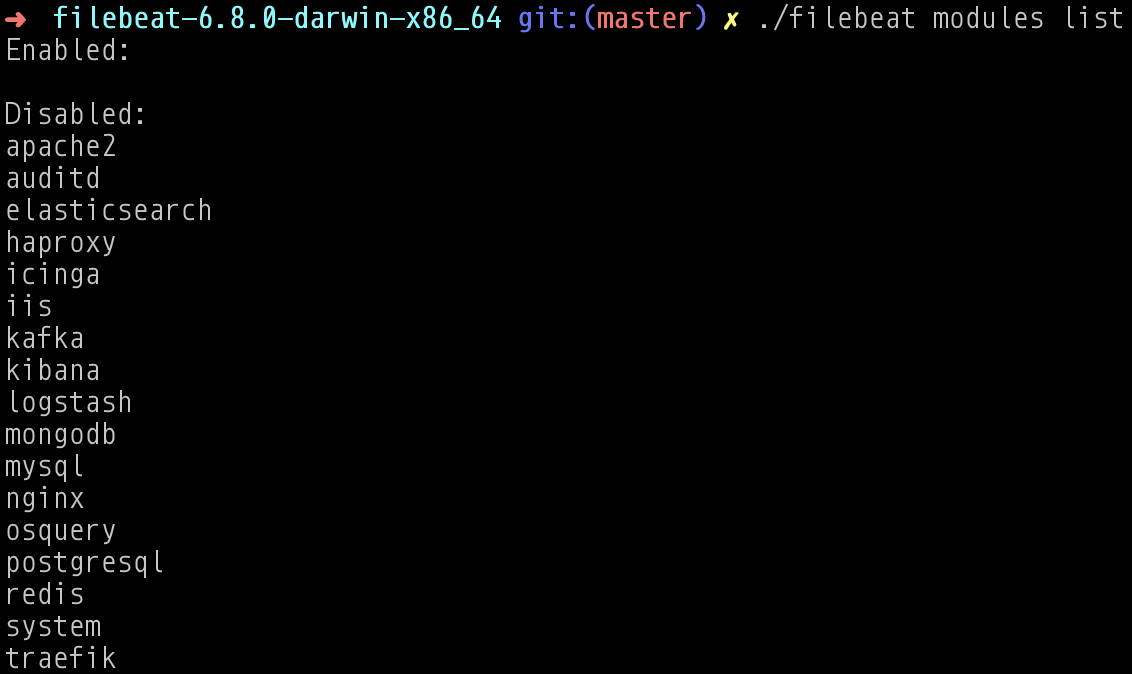
In the above screenshot you can see that there are no enabled Filebeat modules. This means that Filebeat does not know what data it is looking for unless we specify this manually. An example on how to enable a module to process apache logs is to run the following command.
filebeat modules enable apache2

Enabling modules isn't required but it is one of the easiest ways of getting Filebeat to look in the correct place for data.
Configuring Filebeat Manually
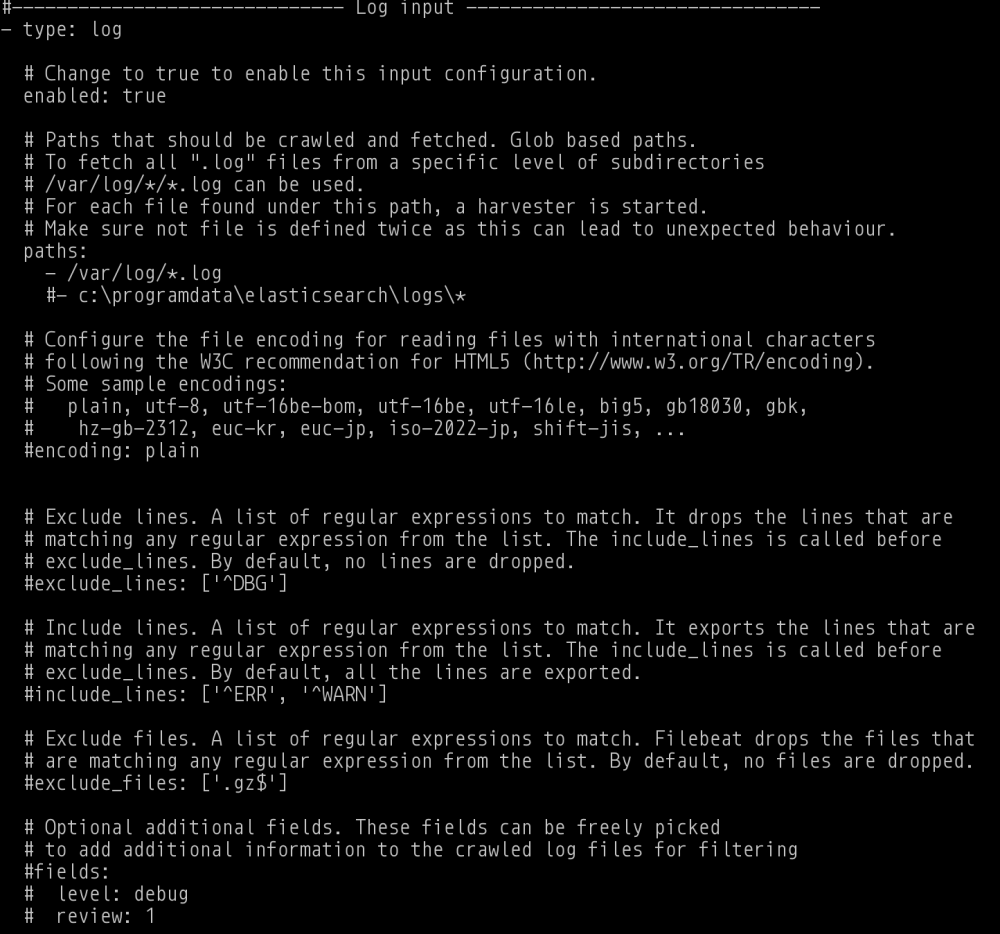
This means that you are not using a module and are instead specifying inputs in the filebeat.inputs section of the configuration file. You can configure paths manually for Container, Docker, Logs, Netflow, Redis, Stdin, Syslog, TCP and UDP.
When specifying paths manually you need to set the input configuration to enabled: true in the Filebeat configuration file.
2. Check your output contains your Logstash host and port
While it may seem simple it can often be over-looked, have you set-up the output in the Filebeat configuration file correctly?
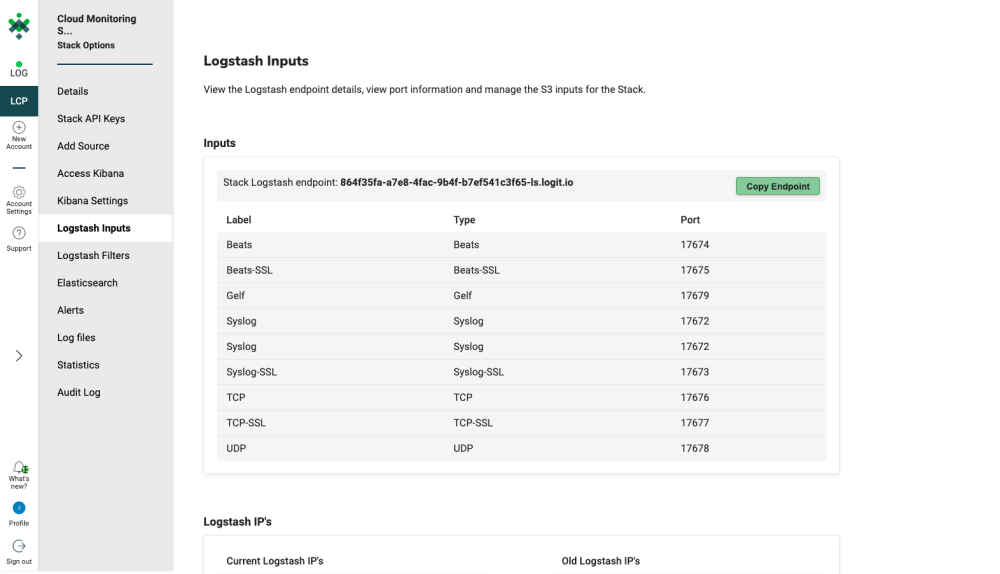
You can find the details for your ELK stack Logstash endpoint address & Beats SSL port by choosing from your dashboard View Stack settings > Logstash Pipelines.
You need to make sure you have commented out the Elasticsearch output and uncommented the Logstash output section. This tells Filebeat we are outputting to Logstash (So that we can better add structure, filter and parse our data).
To comment out simply add the # symbol at the start of the line. To uncomment it's the opposite so remove the # symbol.
A snippet of a correctly set-up output configuration can be seen in the screenshot below.
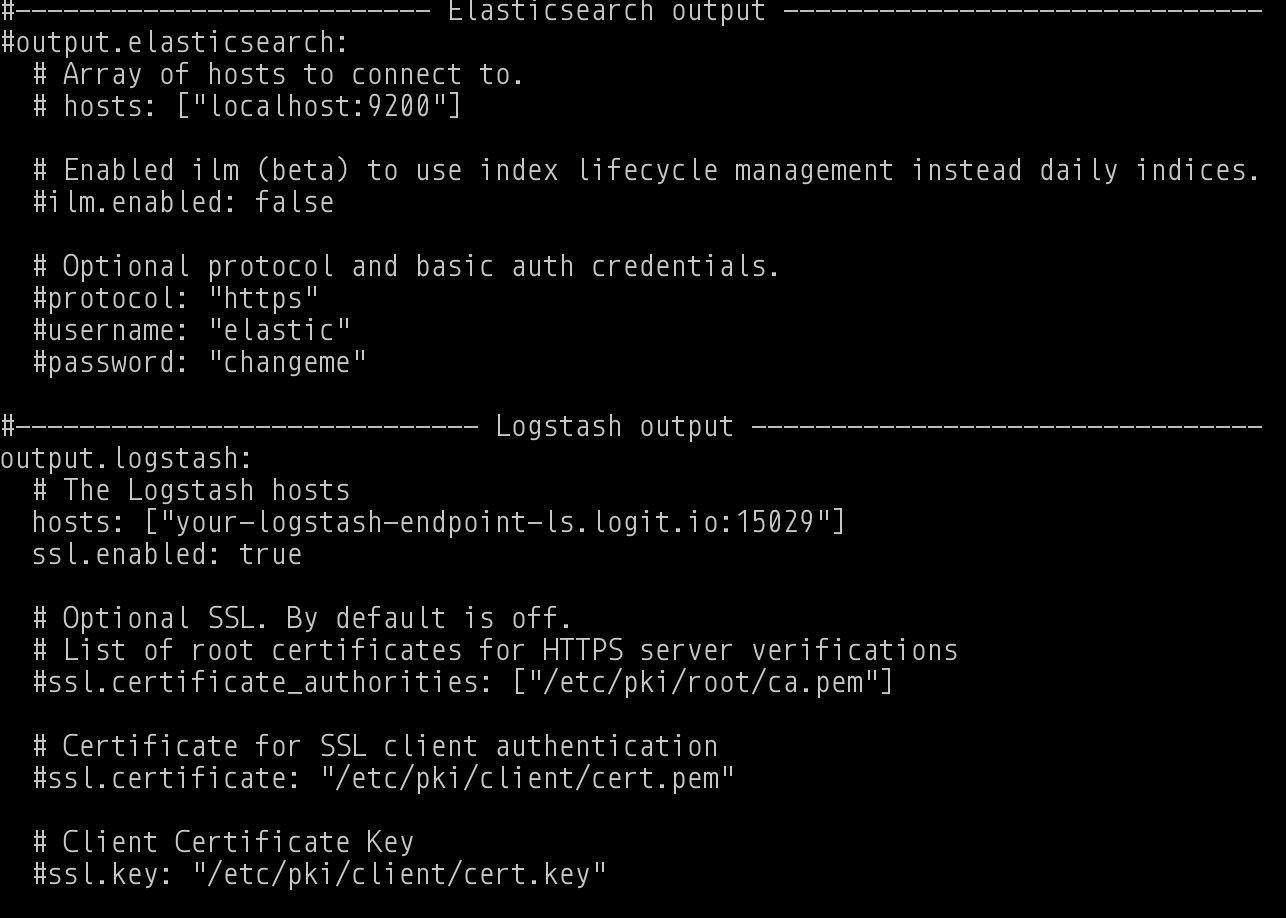
It's also important to get the correct port for your outputs. In the screenshot above you can see that port 15029 has been used which means that the data was being sent from Filebeat with SSL enabled.
3. Are you using a configuration file in an alternative location
It is to be noted that you don't have to use the default configuration file that comes with Filebeat. Lets say you are making changes and save the new filebeat.yml configuration file in another place so not to over ride the original configuration. To tell Filebeat the the location of this file you need to use the -c command line flag followed by the location of the configuration file.
An example of how to do this:
filebeat -c <path_to_config_file>
4. Enable Logging
Manual checks are time consuming, you'll likely want a quick way to spot some of these issues. The good news is you can enable additional logging to the daemon by running Filebeat with the -e command line flag. This will redirect the output that is normally sent to syslog to standard error. You will be able to diagnose whether Filebeat is able to harvest the files properly or if it can connect to your Logstash or Elasticsearch node.For example see the command below.
filebeat -e
Still having trouble?
If you are still having trouble you can contact the Logit support team here.
If you enjoyed this guide on diagnosing issues with Filebeat then why not check out our article on what is SIEM?