
Resources
6 min read
Django is designed to be secure by default, which means that its got a number of featured out of the box to protect against common Web vulnerabilities, including SQL injection, cross-site scripting (XSS), and cross-site request forgery (CSRF). Its extensive documentation, active community, and strong ecosystem of reusable apps and libraries make it a common choice for developers looking to create scalable and maintainable Web applications.
However, as Django log files are often difficult to handle and analyze manually, it is pretty time-consuming and hard to scale in parallel with the growth of your organizational activities. Therefore to make this process simpler for users, many organizations opt for a Django logging solution.
To assist you in understanding Django logging this article will explain provide a Django logging example, the best practices you need to know and list the leading Django logging tools.
Contents
What is Django
Django is a high-level Python web framework that encourages rapid development and clean, pragmatic design. Built to assist developers in writing web applications quickly and effectively, Django follows the ideology of reusability, less code, and the principle of "Don't Repeat Yourself" (DRY). It comes with a rich set of features and tools out-of-the-box, including an ORM (Object-Relational Mapping) for database interactions, a powerful URL routing system, form handling, authentication, and an administrative interface for managing application data.
What is Django Logging
Django logging is a way of monitoring and recording events within a Django application. The logging functionality is built on top of Python's standard logging module, with a flexible framework that allows the generation of log messages from different parts of a Django application. It helps a developer collect information about events, errors, and other important happenings, thus making it easier to monitor application behavior, diagnose problems, and improve general performance and security.
The Most Crucial Django Log Types To Monitor
Monitoring Django logs is a vital aspect of keeping a Django app secure and performing as expected. To assist you in gaining the most value from your Django monitoring practices, we’ve listed the most crucial Django logs to track.
Error Logs
- Server Errors (500): Collect server-side errors to highlight issues in your codebase.
- Client Errors (400): Track client-side errors to comprehend and fix user-related problems.
Security Logs
- Authentication Failures: Monitor failed login attempts to detect potential brute force attacks.
- Permission Denied: Log unauthorized access attempts to sensitive areas of your application.
- Suspicious Operations: Monitor any suspicious operations, such as CSRF attacks or unexpected input patterns.
Performance Logs
- Request/Response Time: Log the time taken to process requests to identify performance bottlenecks.
- Database Query Times: Monitor slow queries to optimize database performance.
Debug Logs
- Debugging Information: Detailed logs that help in troubleshooting issues during development.
- Detailed Execution Flow: Track the flow of requests and actions to identify where issues may be occurring.
Audit Logs
- User Actions: Log vital user actions, such as changes to user settings or data modifications, for audit purposes.
- System Changes: Track changes to the system, such as deployments, configuration changes, or service restarts.
Custom Application Logs
- Business Logic: Monitor crucial events related to your application's business logic to ensure it operates correctly.
- Third-Party Integrations: Log interactions with external services to troubleshoot integration issues.
Django Logging Example
Below is an example of setting up Django logging in a standard Django project. This configuration will log messages to the console and a file, capturing various levels of log messages for numerous parts of the application.
Django Logging Configuration
Add the following LOGGING dictionary to your Django settings.py file:
LOGGING = {
    'version': 1,
    'disable_existing_loggers': False,
    'formatters': {
        'verbose': {
            'format': '{levelname} {asctime} {module} {message}',
            'style': '{',
        },
        'simple': {
            'format': '{levelname} {message}',
            'style': '{',
        },
    },
    'handlers': {
        'console': {
            'level': 'DEBUG',
            'class': 'logging.StreamHandler',
            'formatter': 'simple',
        },
        'file': {
            'level': 'DEBUG',
            'class': 'logging.FileHandler',
            'filename': 'debug.log',
            'formatter': 'verbose',
        },
    },
    'loggers': {
        'django': {
            'handlers': ['console', 'file'],
            'level': 'DEBUG',
            'propagate': True,
        },
        'django.request': {
            'handlers': ['console', 'file'],
            'level': 'ERROR',
            'propagate': False,
        },
        'myapp': {
            'handlers': ['console', 'file'],
            'level': 'DEBUG',
            'propagate': True,
        },
    },
}
Using the Logger in Your Application
You can now use the configured loggers in your Django application. Here’s an example of how to use logging in a Django view.
import logging

#Get an instance of a logger
logger = logging.getLogger(__name__)

def my_view(request):
    logger.debug('Debug message')
    logger.info('Info message')
    logger.warning('Warning message')
    logger.error('Error message')
    logger.critical('Critical message')
    return HttpResponse("Logging example!")
Django Logging Best Practices
Django logging is a crucial aspect of application development, offering developers an overview of the behavior of the application. When implementing logging in Django, to derive the most value, its important to follow these best practices.
Firstly, divide your application into logical chunks and create separate loggers for each. For instance, you may have loggers for core components of Django, third-party libraries, and application-specific modules. This way, you can easily tune the logging level and destination for each of them independently to help with more efficient management and troubleshooting.
Also, set the level of logging based on the importance and relevance of each logger to your application. Use DEBUG when needing highly detailed information for debugging purposes, use INFO to denote any message that pertains to a general operation, use WARNING for potential issues that do not impact functionality, use ERROR when there is an error requiring attention but does not halt the application, and use CRITICAL for a severe error that requires immediate action.
Additionally, Configure log rotation to prevent log files from getting too large and eating up excessive disk space. Rotate logs based on size or time intervals to ensure that the older entries of the logs get archived or deleted accordingly. This maintains the integrity of log files, improves performance, and simplifies log management.
As well as this, be cautious with the logging of sensitive data, like passwords, credentials, or personally identifiable information. Such data should not be logged straight, it must be properly blurred or redacted to protect users' privacy and security regulations.
Lastly, set up a process for the constant monitoring and analysis of logs in order to find trends, anomalies, and possible problems. Utilize log aggregation and log analysis tools to centralize log data, search, filter, and visualize log entries effectively. Monitor key metrics; track error rates and set up alerts to proactively address emerging issues.
The Leading Django Logging Tools
Papertrail
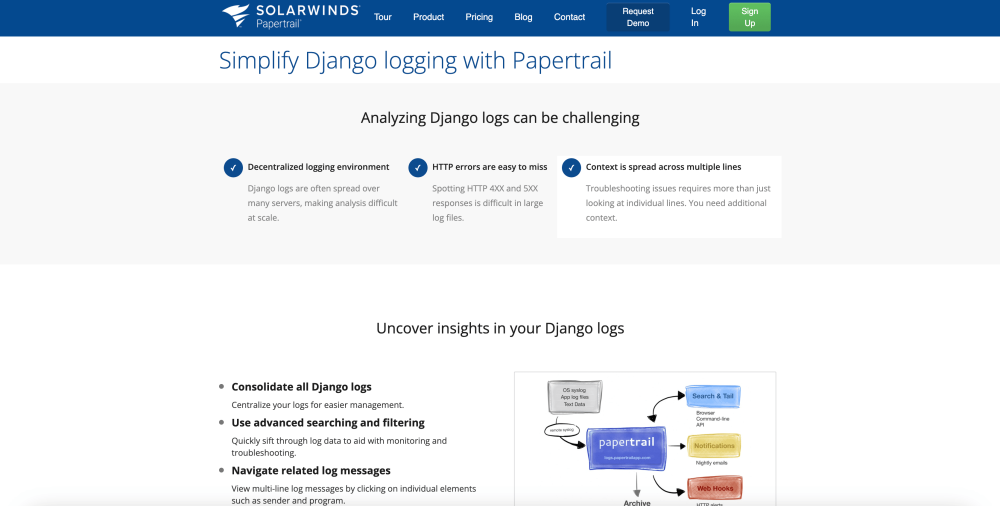
Papertrail assists you in simplifying Django logging by centralizing all your Django logs. The solution enables you to view all your log data simultaneously and search across messages to find the pieces you need and create filters to trim huge volumes of log data down to the essentials. Also, with Papertrail you can navigate around your log data and pull all related context together.
Logit.io
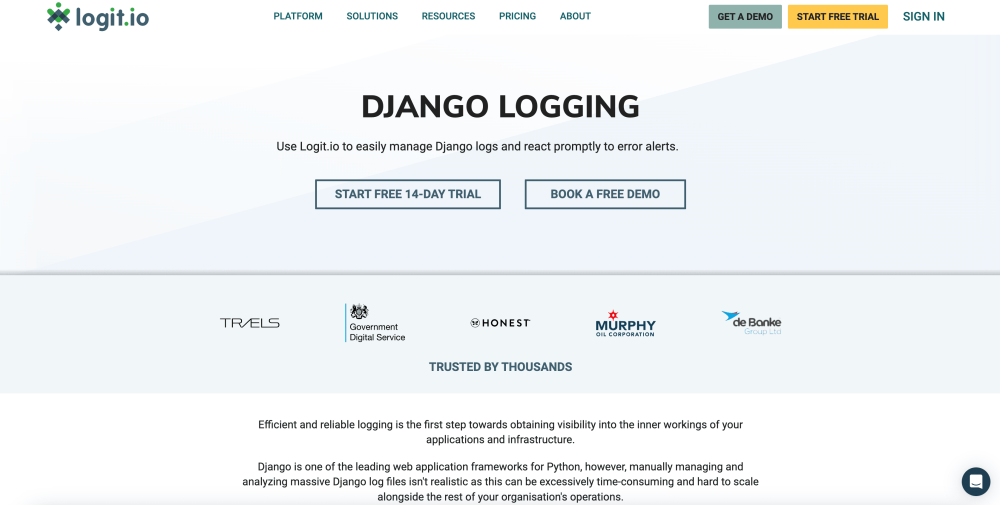
With Logit.io you can utilize its powerful dedicated Django Logging solution and attain full visibility into your applications and infrastructure. This tool offers simplified real-time monitoring to ensure you stay on top of performance stats, error rate, latency, and offers swift insights to allow you and your team to make the appropriate choice during a limited window of time. Lastly, with Django Logging from Logit.io, you can conduct faster root-cause analysis and trace Django performance issues to the exact code line.
If you’re interested in finding out more about Logit.io’s Django Logging tool, feel free to contact us or begin exploring the platform for yourself with a 14-day free trial.
Loggly
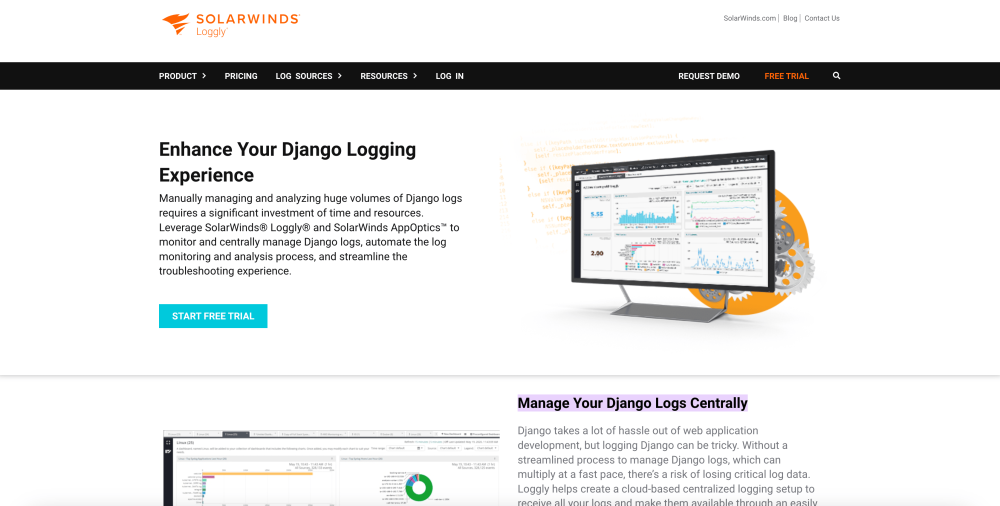
Loggly, part of the SolarWinds family offers a Django Logging tool that enables you to monitor and centrally manage Django logs. Loggly swiftly indexes your logs and provides a unified interface for searching, analyzing, and visualizing your data. As well as this, the solutions search function is based on Lucene and provides many powerful options to cut through the noise in Django logs and find exactly what you’re looking for.
If you've enjoyed this article why not read The 12 Best Open Source Logging Tools or The Top 60 Log Management Tools next?