Resources
10 min read
Last updated:
Graphite provides time-series metrics in an open-source database. With Graphite dashboards, you can see key performance indicators (KPIs) as well as other metrics visually.
Dashboards typically display data as graphs, charts, and tables and can be customized to meet the specific needs of an organization. Using dashboards, organizations can monitor and analyze various aspects of their performance, such as system utilization, application performance, and resource utilization, using web interfaces.
Contents
- What are Graphite Dashboards?
- What is the difference between Graphite and Grafana?
- 1. Monitor OpenStack Instances
- 2. Analysing FreeNas Performance
- 3. Dashboard for Centreon
- 4. Usage monitoring
- 5. Backend monitoring
- 6. Review Server Requests By Country
- 7. Monitoring MongoDB
- 8. Jenkins Reporting
- 9. Monitor MySQL
- 10. Monitor Grafana Carbon Agent Statistics
- 11. Monitor VMWare Virtual Machines
- 12. 0Auth2 Client Monitoring
- 13. App Metrics Web Monitoring
- 14. Icinga2
- 15. OhmGraphite Sensor Data Monitoring
- 16. CollectD Server Metrics
- 17. Nginx Stats
- 18. Telemetry Streaming StatsD for F5 BIG-IP
- 19. Clickhouse Performance Monitor
- 20. Gatling Report
What are Graphite Dashboards?
Graphite-backed dashboards are an essential tool for monitoring and analyzing time-series data in real-time. By providing a visual representation of key performance indicators (KPIs) and other metrics, organizations can easily monitor and comprehend their performance. In addition to providing valuable insights into systems, applications, and resources, graphite dashboards allow organizations to improve their performance by making informed data driven decisions.
What is the difference between Graphite and Grafana?
Graphite and Grafana are both open-source software used for monitoring and visualizing data, but they have a number of different functionalities and features.
Time-series databases like Graphite allow you to query and analyze numeric data over time. The tool is designed for the storage and display of time-series data, such as server metrics, network traffic, and application performance metrics. The simplicity of graphite's architecture and its ease of installation and setup make it a popular choice for small and medium-sized enterprises.
In contrast, Grafana is a data visualization tool that lets you create interactive dashboards for displaying and analyzing data from various sources, including Graphite, Elasticsearch, InfluxDB, and Prometheus. A wide range of features are available, including dynamic and interactive graphs, alerts, and dashboard creation and sharing. In addition, Grafana is supported by a large community of developers and users.
As a summary, Graphite is a time-series database, and Grafana is a visualization tool that can display data from several sources, including Graphite. With Graphite, you can store and query time-series data, while with Grafana, you can visualize and analyze data from various sources.
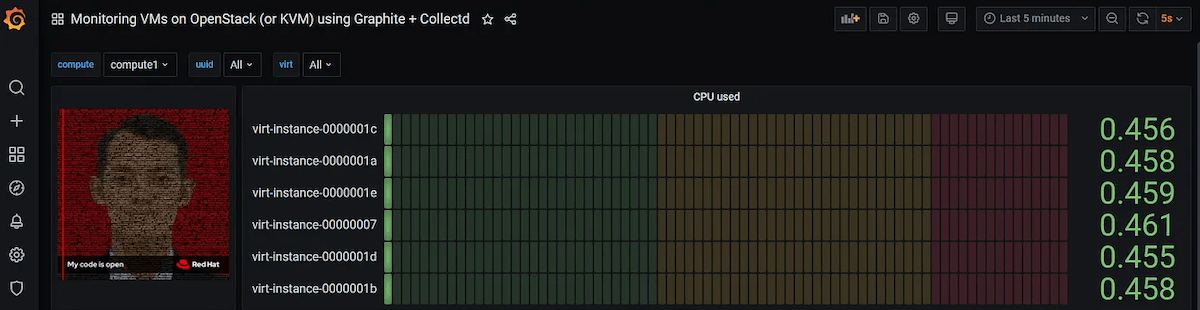
1. Monitor OpenStack Instances
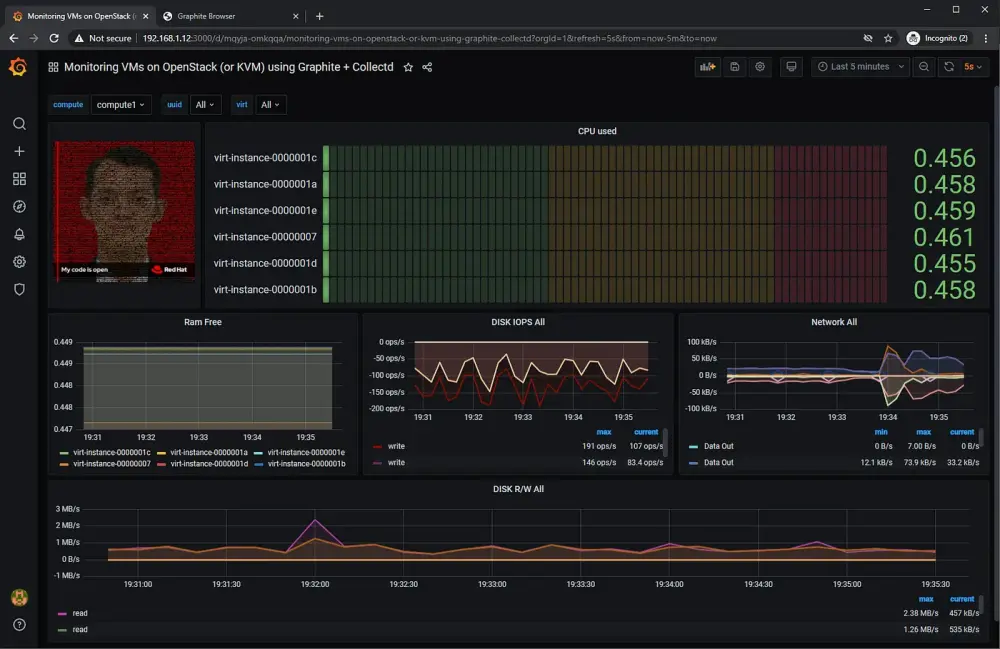 Credit: Ach.Chusnul Chikam
Performance tracking for OpenStack instances provides insight into the performance of the cloud infrastructure and ensures that applications and services run smoothly. In addition to these reasons, performance tracking is important for the following use cases:
Monitoring allows administrators to identify and resolve issues in real-time, before they become critical, by detecting performance degradation.
Performance metrics can be used by administrators to identify resource constraints, such as CPU, memory, or disk usage, and make changes as necessary.
Diagnose and resolve performance issues using performance tracking data, including identifying the root cause and evaluating the impact of configuration changes that may have previously been made.
2. Analysing FreeNas Performance
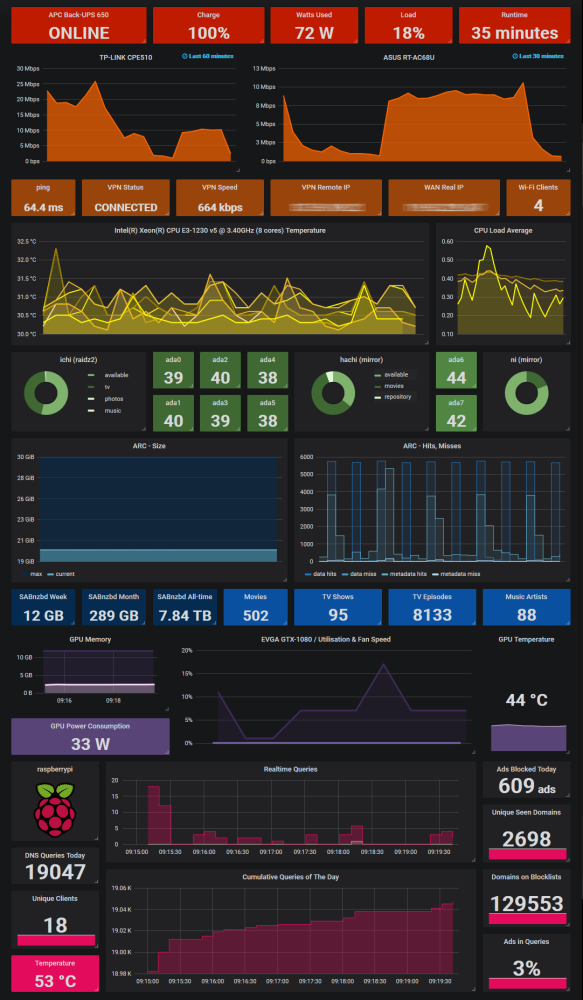
Credit: @Phar0e
FreeNAS dashboards provide users with a centralized view of their system's status and performance. System health, network activity, storage utilization, and system performance are all displayed on this dashboard. As well as providing real-time information about the storage utilization of the system, this dashboard displays the number of files and directories, and the disk usage per file system.
Besides providing information about network activity, it also shows the number of active connections and bandwidth utilization. Information such as this can be used to identify and resolve network performance bottlenecks.
This FreeNAS dashboard also displays performance metrics, such as CPU usage, memory usage, and disk I/O, which are useful for monitoring system health and performance. In addition to identifying performance issues, these metrics can also be used to optimize the system for better performance.
Unlock complete visibility with hosted ELK, Grafana, and Prometheus-backed Observability
Start Free Trial3. Dashboard for Centreon
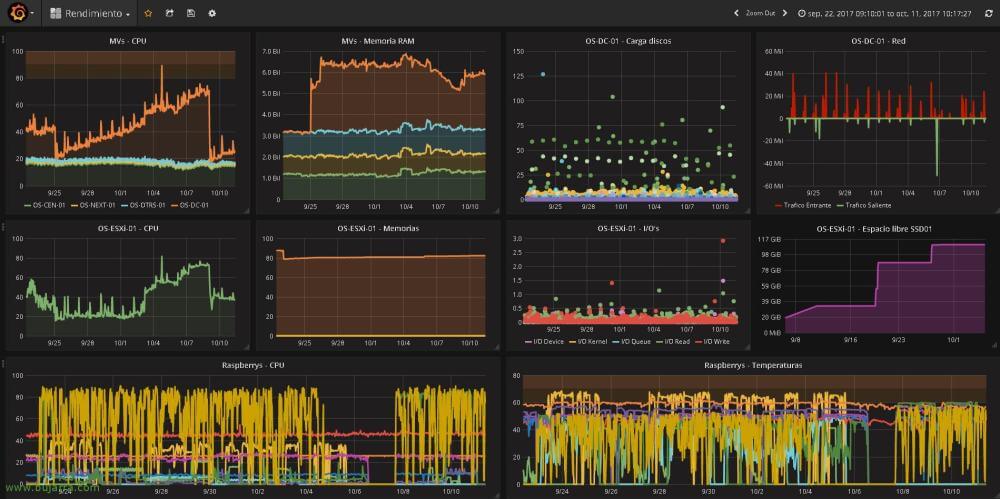 Credit: Hector Herrero
Centreon is an open-source monitoring solution for IT infrastructure. The system enables businesses and organizations to monitor their IT infrastructure in real-time, such as servers, network devices, and applications, to make sure everything is running smoothly. To provide advanced monitoring capabilities for Centreon, Grafana and Graphite can be used together as shown in this example.
4. Usage monitoring
 Credit: Martin Bydzovsky
Using usage monitoring in troubleshooting allows you to see how a system, application, or network is being used. Administrators can identify potential problems by analyzing usage data, such as resource bottlenecks, misconfigurations, or performance degradation. Additionally, usage data can be used to track changes over time, which can be useful for diagnosing and resolving newly occurring issues.
Usage monitoring, for example, can determine whether a slow or unresponsive application is due to a shortage of system resources, such as CPU, memory, or disk space. Similarly, usage monitoring can help identify which devices or components are causing network performance problems, such as a slow switch or a congested link.
5. Backend monitoring
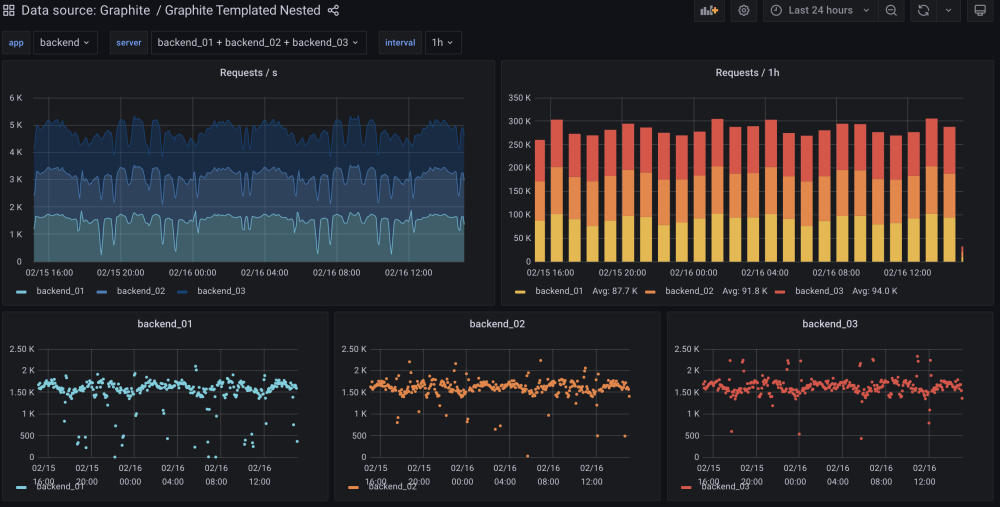 Credit: Grafana
In order to optimize the performance of a system, it is necessary to monitor the backend for a variety of reasons, including for viewing system health and undertaking performance optimizations. In addition to that, it is often required for issue detection and capacity planning as well.
Consequently, backend monitoring can also help identify security breaches and attacks on your system, so you can respond quickly and take appropriate action to protect your data and users as soon as they occur.
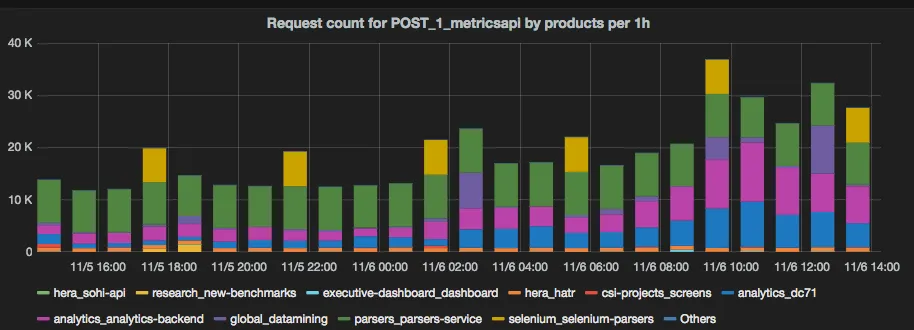
6. Review Server Requests By Country
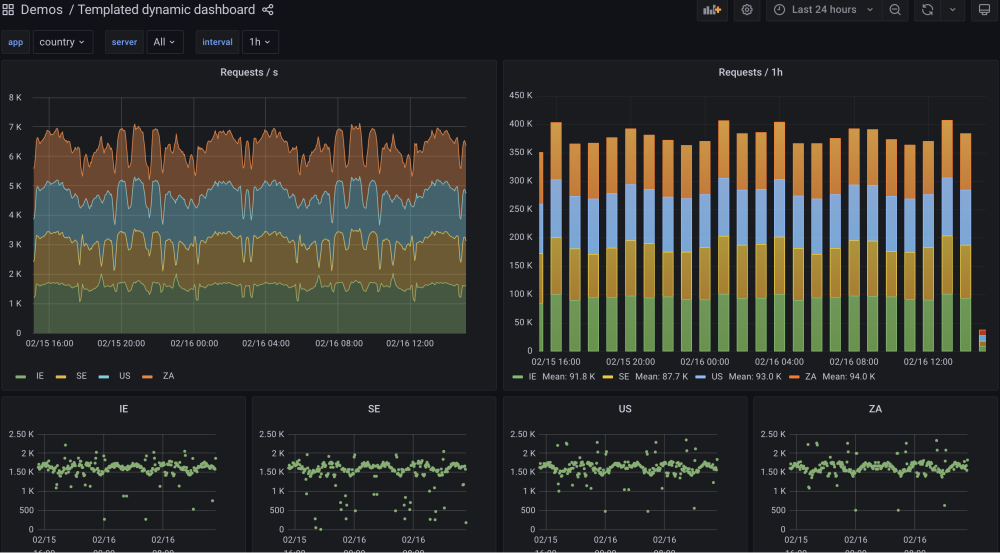 Credit: Grafana
This particular example illustrates how reviewing server requests by country can offer several benefits. By reviewing server requests by country, you can identify unusual patterns or anomalies in requests coming from specific countries. High requests or unusual activity from a certain country may indicate that the country is a potential source of security threats.
Reviewing server requests by country can help you identify where most of your traffic is coming from. Understanding this will allow you to identify areas where your server may be underperforming due to high traffic volume and optimize its performance.
In certain countries, there may be specific regulations around the storage and processing of data that you handle. It is imperative to review server requests by country in order to ensure compliance with any relevant regulations and avoid potential legal pitfalls.
Studying server requests by country can also help you understand how customers from different regions interact with your website. By using this information, you can tailor your content and services to better meet the needs and preferences of your customers around the world.
7. Monitoring MongoDB
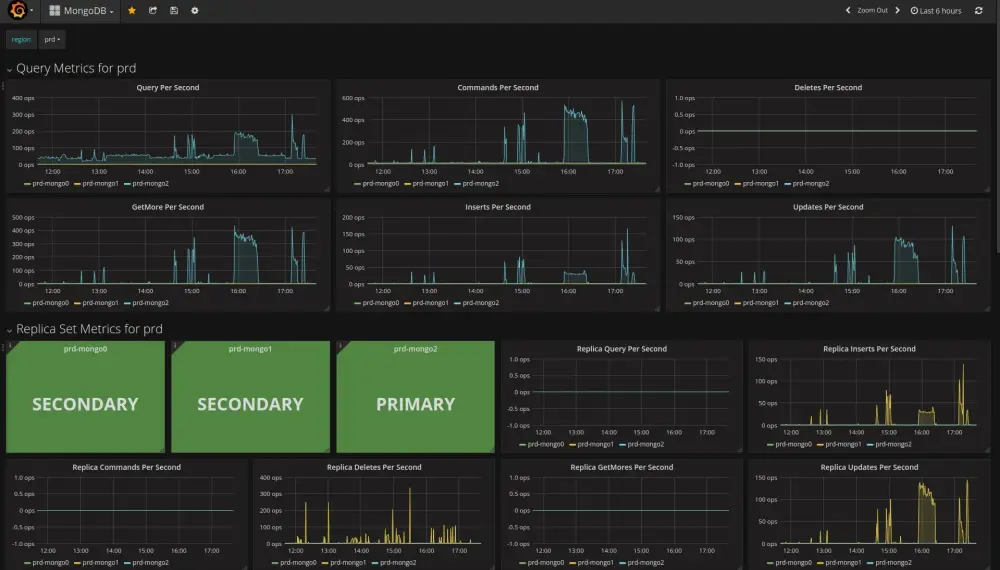
MongoDB monitoring is key for ensuring high availability, as MongoDB is often used in environments where high availability is critical. It is also helpful for improving performance, as monitoring this tool helps administrators identify performance bottlenecks.
8. Jenkins Reporting
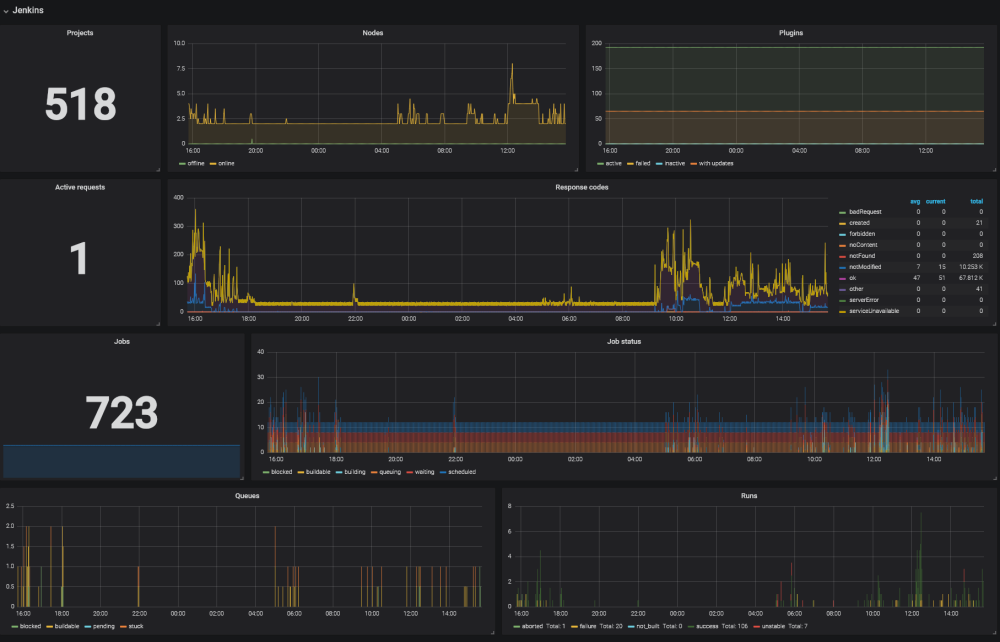 Credit: @eberkut
As Jenkins metrics can provide valuable data that can inform important decisions related to your development process, having an intuitive Jenkins dashboard can greatly assist your team in improving decision-making. To determine whether to invest in additional hardware or cloud resources, you might use these metrics to determine which build agents are underutilized and may be repurposed.
By regularly reviewing Jenkins metrics and using them to inform decisions and optimizations, monitoring in this manner can also aid in continuous improvement of your development process. Over time, you can iterate and improve your workflows, infrastructure, and tools, resulting in more efficient and effective software development.
9. Monitor MySQL
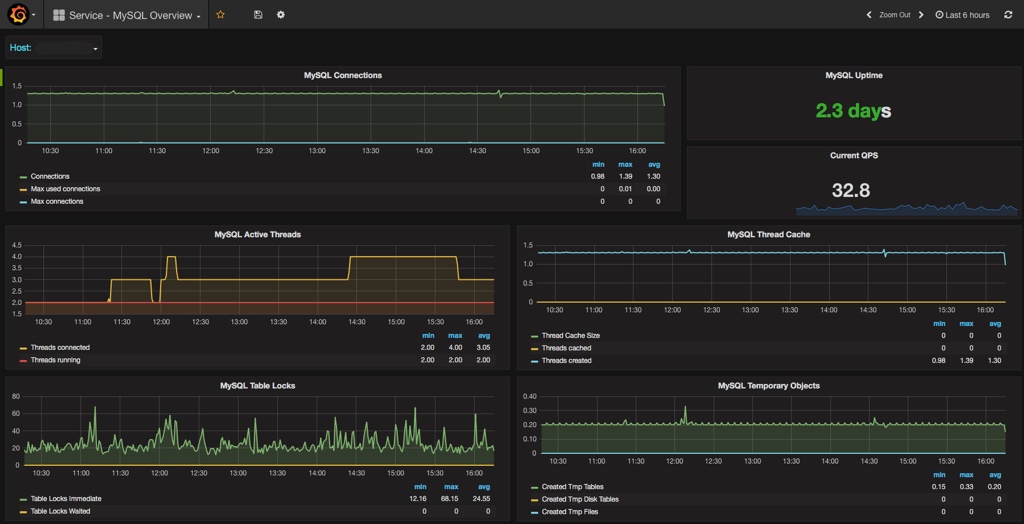 Credit: @matejz
Monitoring MySQL is an essential part of managing and optimizing your database system in order to maximize its performance. When you keep track of your database's performance, security, and capacity, you can ensure that the database is running smoothly and efficiently, as well as proactively address any issues that may arise before they become more serious.
10. Monitor Grafana Carbon Agent Statistics
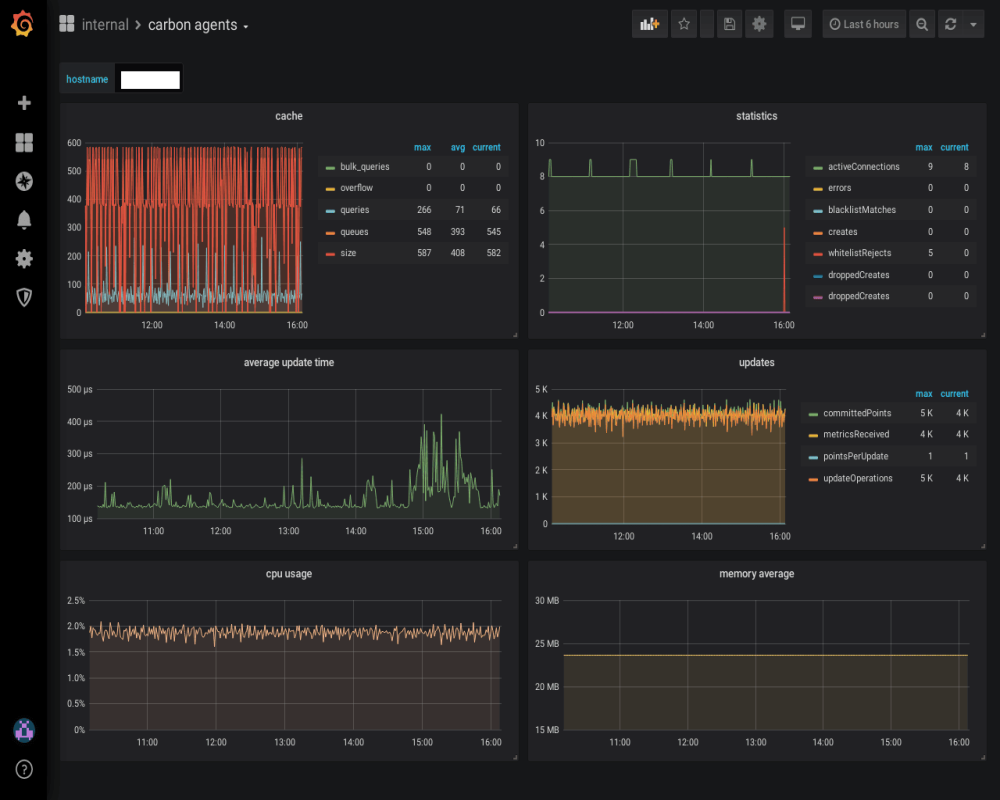 Credit: @sobaka
This dashboard visualizes various statistics realating to your Grafana carbon agent. Carbon enables you to assemble a sophisticated architecture for your storage back end. With this Graphite dashboard you can view a range of metrics including but not limited to average update time, cache, and CPU usage.
11. Monitor VMWare Virtual Machines
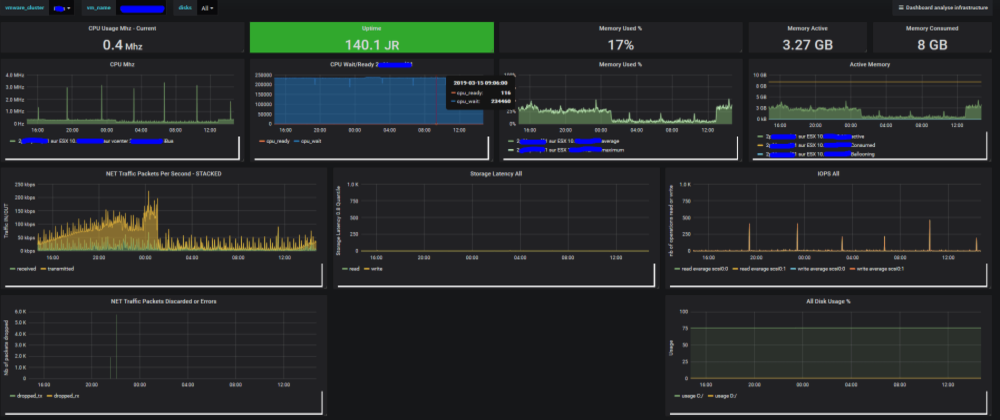 Credit: @xkilian
Effectively observe your VMWare ESX hosted virtual machines that are collected by vsphere-graphite with this intuitive dashboard. This particular dashboard surfaces automatically available clusters, virtual machines, and utilizes Prometheus as its datasource. With this dashboard you can monitor metrics like memory used, all disk usage and uptime.
12. 0Auth2 Client Monitoring
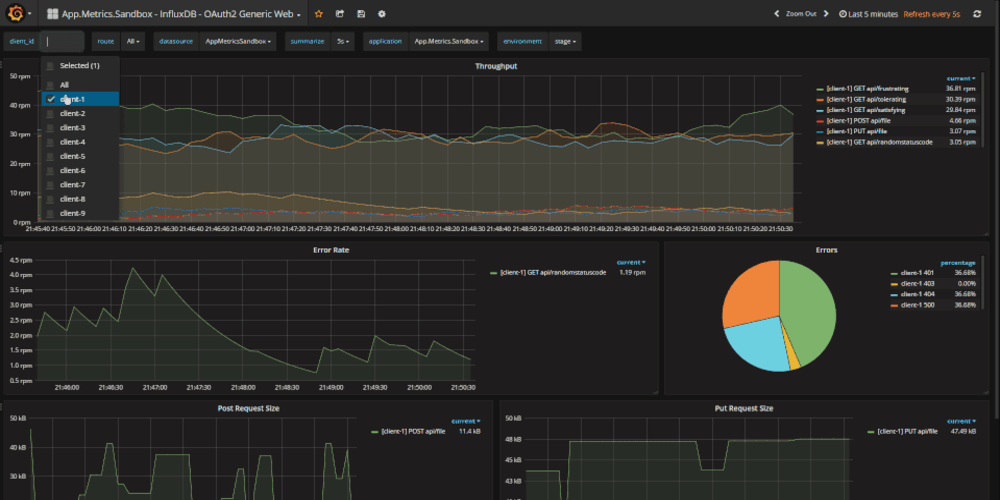 Credit: @Allan Hardy
OAuth 2.0 is the industry-standard protocol for authorization. This Graphite dashboard example is built with App Metrics InfluxDB reporting. With this dashboard you can monitor metrics including throughput, error rate, and post request size.
13. App Metrics Web Monitoring
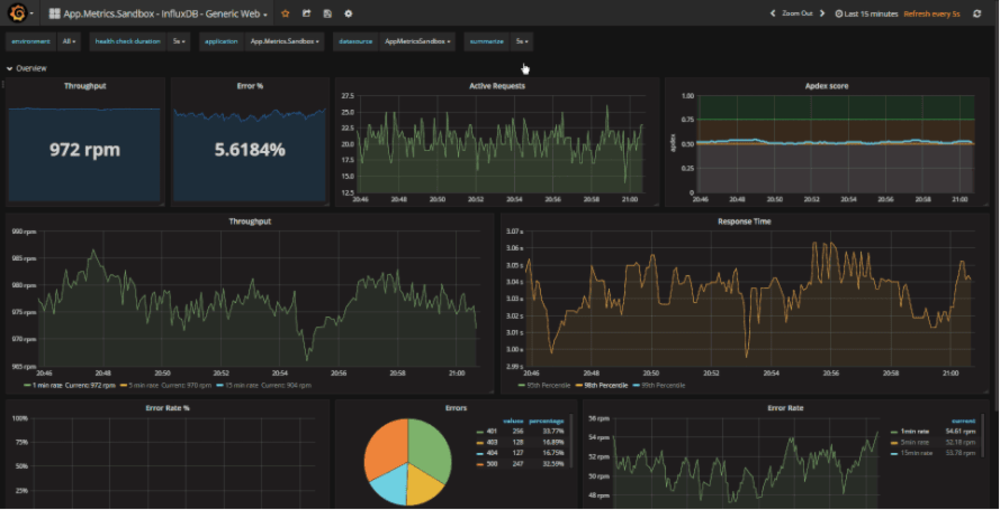 Credit: @Allan Hardy
App Metrics is an open-source and cross-platform .NET library used to record metrics within an application. Utilizing App metrics simplifies the process of visualizing your application’s metrics in real-time, in this example it's web applications. With this dashboard you can monitor metrics like acticve requests, response time, and Apdex score.
14. Icinga2
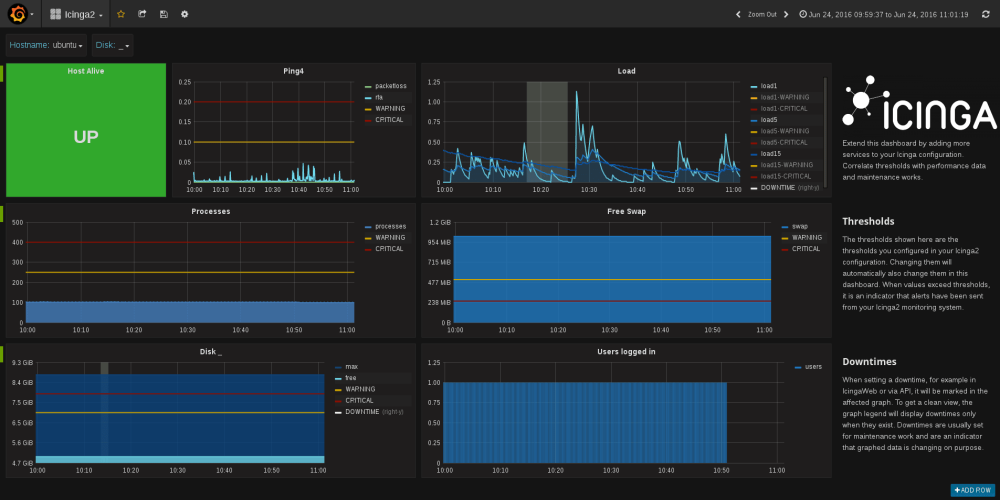 Credit: @Icinga Project
Icinga is a monitoring solution that checks the availability of your network resources & notifies users of the risk of outages among other key insights. Utilize this Graphite dashboard with a default Icinga2 installation and monitor different states about a host and its services. By utilizing this dashboard you can monitor a range of metrics, including processes, load and disk space.
15. OhmGraphite Sensor Data Monitoring
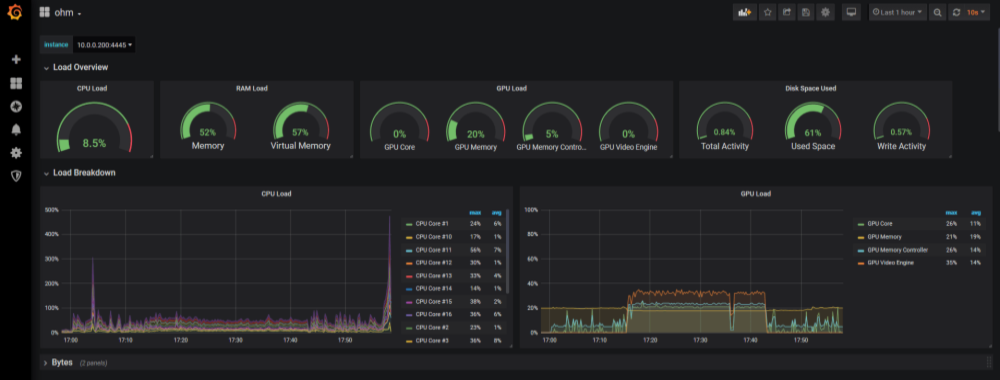 Credit: @nickbabcock
OhmGraphite is a Windows service that exposes hardware sensor data to make this more easily ingestible for reporting purposes. This dashboard requires the use of graphite tags, so it's important that the graphite datasource has tags enabled both on the server side and in OhmGraphite. With this dashboard you can monitor metrics like RAM usage, GPU usage, and CPU usage clearly.
16. CollectD Server Metrics
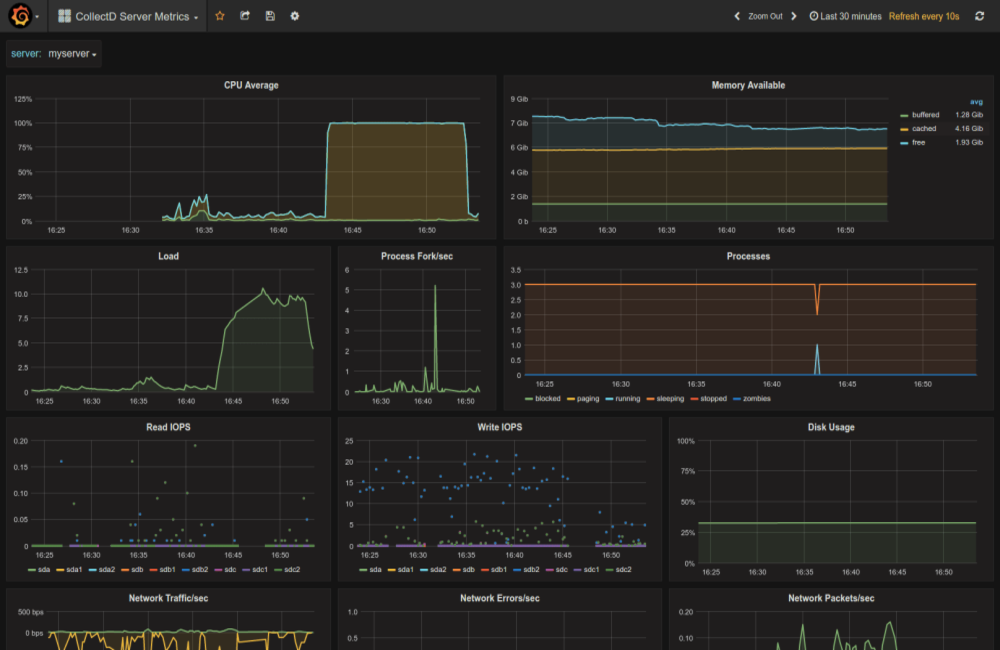 Credit: Torkel Ödegaard
By utilizing this Graphite dashboard you can monitor server metrics from CollectD. CollectD gathers metrics from various sources, such as the operating system, applications, servers and external devices, and stores this information for centralised processing. With this dashboard you can view metrics like available memory, disk usage, and processes.
17. Nginx Stats
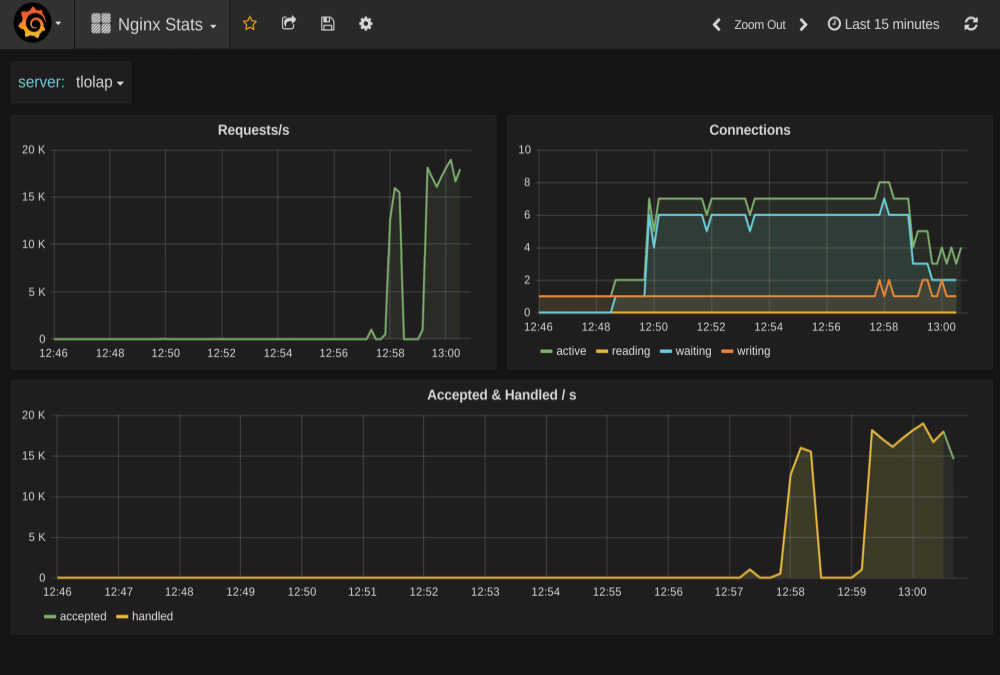 Credit: @Torkel Ödegaard
This Graphite dashboard presents Nginx statistics by using CollectD and Graphite together. Nginx is a web server that can also be used as a reverse proxy, load balancer and HTTP cache. With this dashboard you can view a range of metrics including key metrics around requests and connections.
18. Telemetry Streaming StatsD for F5 BIG-IP
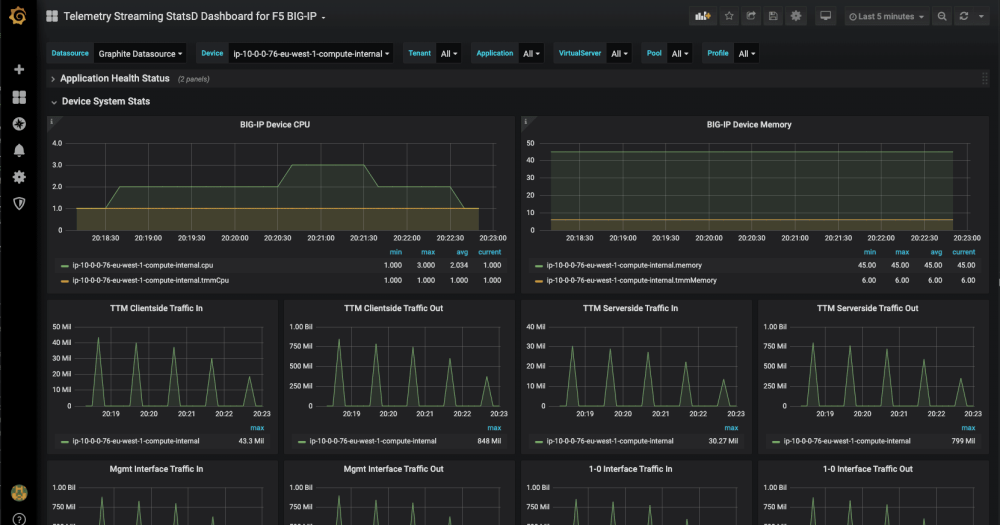 Credit: @Bart Van Bos
This dashboard example presents F5 BIG-IP StatsD exported metrics to Graphite, from the F5 Automation Toolchain, specifically the Telemetry Streaming (TS) module. F5's BIG-IP is a group of products encompassing software and hardware designed around application availability, access control, and security solutions. With this dashboard you can observe metrics relating to application health and virtual servers.
19. Clickhouse Performance Monitor
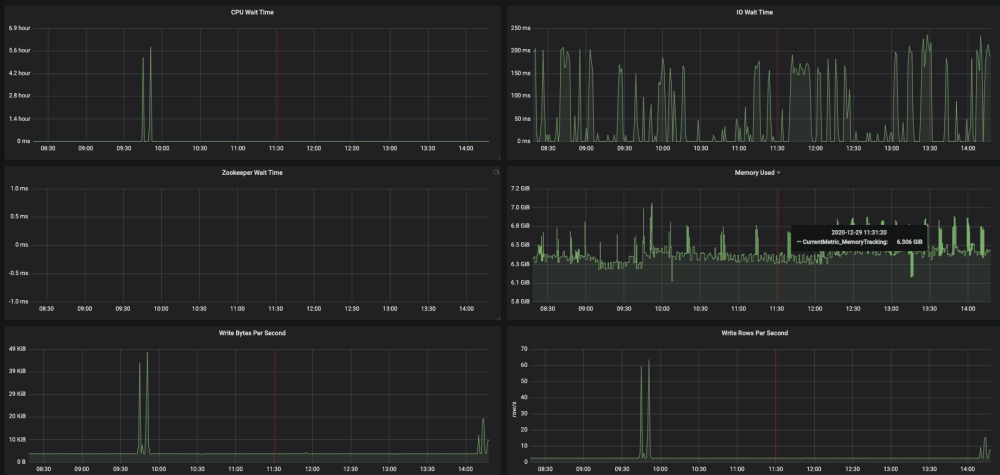 Credit: @Peng.Zhao
Clickhouse is an open-source column orientated database management system for online analytical processing which enables users to produce analytical reports using SQL queries in real-time. With this Graphite dashboard example you can monitor the performance of your Clickhouse configuration and view metrics such as HTTP connections, memory usage, and failed QPS.
20. Gatling Report
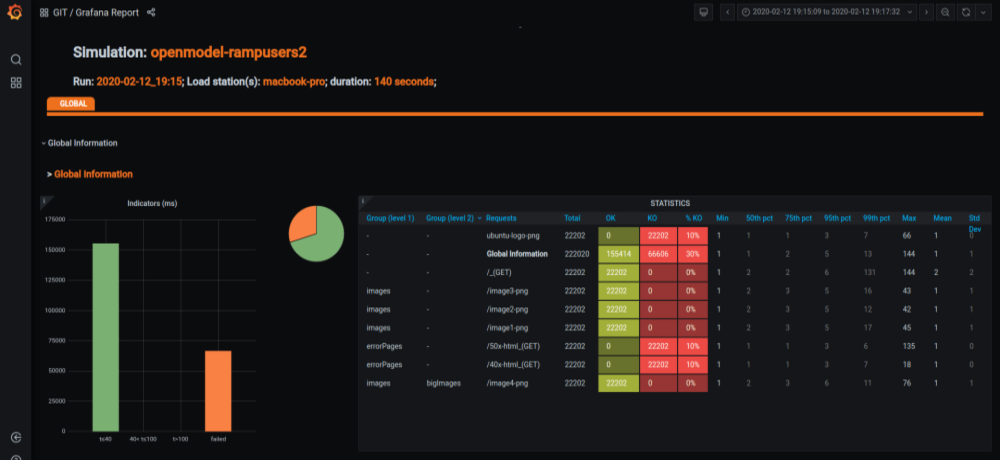 Credit: @Vyacheslav Smirnov
Gatling is a load-testing solution for applications, APIs, and microservices. With this dashboard you can filter by load station or group, enabling further analysis. This dashboard visualizes a range of metrics such as active users, requests per second, and other key indicators.
If you enjoyed this post then why not check out our guide to open source SIEM or our article on telemetry data?