
Resources, How To Guides
12 min read
Last updated:
Java is a popular programming language, developed almost 30 years ago by Sun Microsystems, based on the main theory of ‘write once, run anywhere’ (WORA). Due to Java having been around for a long time, numerous learning resources are available for new developers which further adds to its popularity. Also, Java code can operate on any underlying platform like Windows, Linux, iOS, or Android without rewriting. This makes it especially powerful in today’s environment, where users need applications on multiple devices.
Due to the versatility and popularity of Java, effective monitoring has become vital. Therefore numerous users conduct Java Application Performance Monitoring (APM) to ensure that their Java applications run efficiently, reliably, and at scale.
Continuing with our series of how-to guides, this entry will focus on utilizing Java with Logit.io, including best practices and advantages of conducting Java APM, Java vs Python, and how to utilize Java with Logit.io for enhanced monitoring and analysis.
Contents
What is Java?
Java is a high-level, widely utilized programming language created by Sun Microsystems, now a subsidiary of Oracle Corporation. Java's code, therefore, can be written on one given platform, and without any alteration. The solution can run on any other platform that supports Java. This cross-platform capability is enabled through the JVM, which interprets Java bytecode, an intermediate representation of Java programs, into machine code that runs on any device.
High-level programming languages such as Java serve as a bridge between human-readable language and machine-level code. To effectively use Java, a developer must understand two key components:
- Java Language and APIs: This represents the front-end interface where the developer interacts directly with the Java platform.
- Java Virtual Machine (JVM): This is the back-end component responsible for translating Java code into machine language, enabling communication between the Java platform and the underlying hardware.
Java is a fast, secure, and reliable programming language, ideal for developing a wide range of applications, from mobile apps and enterprise software to big data solutions and server-side technologies.
How to Write to a File in Java?
In Java, writing to a file is an easy process and can be conducted through numerous methods. It is most commonly done using the FileWriter and BufferedWriter classes, which offer a simple way to manage file I/O operations. These classes are part of Java's java.io package. The basic process involves creating or opening a file, writing data to it, and then closing the file to guarantee that all data is saved properly and resources are released. For larger or more complex file-writing operations, it's common to use BufferedWriter along with FileWriter to improve performance by buffering the output before writing it to the file.
What is a Package in Java?
In Java, a package is a way of organizing classes, interfaces, and all other types of related resources into namespaces to maintain and avoid naming conflicts, modularly. They also provide control over access, for example, classes and members may be restricted to a package only. There are two types of packages in Java, built-in packages like java.util, and java.io, which come with a standard library, and user-defined packages, which developers create to structure their applications. By using packages, Java facilitates hierarchical class structures and better management of large projects.
Java Application Performance Monitoring (APM)
Java APM: Best Practices
A fundamental best practice often implemented with Java APM is the instrumentation of key components within your application. This includes monitoring performance statistics such as response times, throughput, and error rates in vital transactions, services, and methods. Focusing on such core areas gives a deep view into application performance and hence easy identification of bottlenecks. Leverage tools for instrumentation like OpenTelemetry or any other APM agent, as these can automatically instrument your code to derive more performance data details and less human effort involved.
Additionally, monitoring the JVM (Java Virtual Machine) is essential for understanding how your application interacts with system resources. Key JVM metrics include heap memory utilization, garbage collection activity, thread counts, and class loading. Through close monitoring of these metrics, you can detect memory leaks, excessive garbage collection pauses, or thread contention issues. These are typical sources of performance degradation with a Java application, so ensure your APM solution provides comprehensive JVM monitoring.
Another best practice when conducting Java APM is to perform load testing and performance testing in an environment similar to production, including network and system set-ups, as well as the emulation of real-life traffic patterns and data loads. By doing this you can observe your application behavior using APM tools while performing tests under stress, and find issues before they make it to production.
A final best practice of Java monitoring is conducting effective distributed tracing. A single transaction might cut across many services in a modern microservice architecture. Because of this, distributed tracing must be applied. With distributed tracing you can follow requests as they come in and pass between different services within your Java application. This will help you to track where delays or errors happen in a complex, distributed system. Jaeger is perfect for distributed tracing and is available as a hosted solution with Logit.io.
Advantages of Conducting Java APM
Java Application Performance Monitoring (APM) tools provide several key benefits that help organizations maintain the health, performance, and reliability of their Java-based applications. Firstly, Java APM tools monitor a set of critical JVM metrics such as heap memory usage, garbage collection activity, thread pools, and CPU utilization. Using this kind of information, APM solutions enable the optimization of resource allocation and usage in improving application performance. This means organizations can attain cost optimizations by detecting underutilized resources and readjusting resource allocations.
Another benefit of conducting APM for Java applications is that tracing method levels are possible with Java APM tools. This means a developer can narrow performance issues down to particular lines of code or methods that are causing problems. Such granularity would be extremely valuable for Java applications because often, the root of performance issues lies in complex logic, inefficient loops, or poorly optimized algorithms. Once pinpointed at the method level, such issues allow developers to fine-tune the efficiency of critical code paths and improve general application performance.
Additionally, most Java applications are based on asynchronous programming and multi-threaded processing meaning they execute multiple tasks at one time. Java APM tools track asynchronous task performance and multi-threaded operation visuals to help developers understand how different threads execute, what blocks, when, and how tasks are scheduled and processed. This visibility helps optimize concurrency and improves the application's responsiveness.
Lastly, numerous Java monitoring tools provide native support for several popular Java frameworks, such as Spring, Hibernate, Apache Struts, or Java EE. This means they automatically recognize and monitor components specific to these frameworks, like database queries, HTTP requests, and transaction management. This native optimization will smooth the process of integration and make sure that vital aspects of application performance are thoroughly monitored.
APM from Logit.io
Logit.io provides a robust, cost-effective application performance monitoring (APM) solution tailored for tracking Java applications. Our platform offers fully open APM and trace analytics without vendor lock-in or data egress fees, alongside straightforward, transparent billing.
Built on a foundation of open-source technologies like the ELK Stack and Grafana, Logit.io delivers extensive log, metrics, and trace analytics capabilities essential for effective application monitoring and optimization. To learn more about Logit.io's APM solutions, feel free to reach out or start exploring the platform with a 14-day free trial.
Unlock complete visibility with hosted ELK, Grafana, and Prometheus-backed Observability
Start Free TrialJava vs Python
As stated Java is one of the most widely used programming languages and commonly developers decide between opting for Java or Python to build their applications. Both of these programming languages are popular and renowned in their domain for the numerous advantages they provide. However, there are some differences between the two tools that lead one tool to be better adapted for a specific use case.
Similarities
- High-Level Languages: Java and Python are high-level, which means they are easy to read, write, and understand. Therefore, they are accessible to beginners but powerful enough for advanced developers.
- Object-Orientated Programming: Both languages support object-oriented principles of inheritance, polymorphism, encapsulation, and abstraction. They allow developers to model the real world through classes and objects, promoting code reusability and modularity.
- Cross-Platform Compatibility: Java and Python are cross-operating system languages, meaning they can compile code written in either language on different operating systems, just with minor adjustments. This is possible for Java because of the JVM, whereas Python is due to the interpreter made for different platforms.
- Strong Community Support: Large and active communities exist for Java and Python developers. This includes extensive library support, frameworks, and a lot of documentation, tutorials, and forums.
Differences
- Syntax and Readability: Python is renowned for its simple, clean, and easy-to-read syntax. It uses indentation to define code blocks, enhancing code readability and lessening the likelihood of errors. Whereas Java has a more verbose syntax that uses braces ‘{}’ to define code blocks and requires explicit declaration of variables and types. This verbosity can make Java code longer and more complex compared to Python’s clean and simple code.
- Performance: As a whole Java is faster in execution when compared to Python. This is due to it being a statically typed, compiled language. Java code is compiled into bytecode, which runs on the JVM, providing increased performance for CPU-intensive tasks.
- Typing System: Python utilizes dynamic typing, so variable types are determined at runtime. This makes Python more flexible but can also lead to runtime errors if not handled carefully. In contrast, Java uses static typing, requiring variable types to be explicitly declared. This can prevent type-related errors at compile time and enhance code safety and predictability.
- Use Cases: Python is highly favored for data science, machine learning, artificial intelligence, scripting, and rapid application development due to its simplicity and the availability of scientific libraries like NumPy, Pandas, and TensorFlow. Java, due to its robustness, scalability, and strong performance, is consistently chosen for large-scale enterprise applications, Android app development, web applications, and server-side technologies.
How to Use OpenTelemetry to Ship Java Traces to Logit.io
For a complete integration guide on using OpenTelemetry to send Java traces to Logit.io, please refer to our documentation. The guide provides step-by-step instructions to help you start monitoring Java traces in Logit.io and leverage various open-source tools as hosted solutions for efficient analysis. Below, we have listed the simple steps that enable you to integrate Java with Logit.io.
1. Install
Open the command prompt or terminal and navigate to where you want your project to live, then paste in the following command:
mvn archetype:generate -DgroupId=logit.apm.testapp -DartifactId=java-project -DarchetypeArtifactId=maven-archetype-quickstart -DinteractiveMode=false
You will see that a folder has been created called 'logit-apm-test-app', navigate into this folder and you will see a file called pom.xml.
Open this file using your preferred text editor, then copy and paste the code below into the file and save the changes:
<project xmlns="http://maven.apache.org/POM/4.0.0"
  xmlns:xsi="http://www.w3.org/2001/XMLSchema-instance"
       xsi:schemaLocation="http://maven.apache.org/POM/4.0.0
  	 http://maven.apache.org/maven-v4_0_0.xsd">
  <modelVersion>4.0.0</modelVersion>
  <groupId>logit.apm.testapp</groupId>
  <artifactId>java-project</artifactId>
  <packaging>jar</packaging>
  <version>1.0-SNAPSHOT</version>
  <name>java-project</name>
  <url>http://maven.apache.org</url>

  <properties>
      <!-- https://maven.apache.org/general.html#encoding-warning -->
      <project.build.sourceEncoding>UTF-8</project.build.sourceEncoding>
      <maven.compiler.source>1.8</maven.compiler.source>
      <maven.compiler.target>1.8</maven.compiler.target>
  </properties>

  <dependencies>
      <dependency>
          <groupId>junit</groupId>
          <artifactId>junit</artifactId>
          <version>4.12</version>
          <scope>test</scope>
      </dependency>
      <dependency>
        <groupId>io.opentelemetry</groupId>
        <artifactId>opentelemetry-api</artifactId>
        <version>1.30.1</version>
      </dependency>
      <dependency>
          <groupId>io.opentelemetry</groupId>
          <artifactId>opentelemetry-sdk</artifactId>
          <version>1.30.1</version>
      </dependency>
      <dependency>
          <groupId>io.opentelemetry</groupId>
          <artifactId>opentelemetry-exporter-otlp</artifactId>
          <version>1.30.1</version>
      </dependency>
  	    <dependency>
        <groupId>io.opentelemetry</groupId>
        <artifactId>opentelemetry-exporter-jaeger</artifactId>
        <version>1.10.0</version>
      </dependency>
  </dependencies>
    <build>
    <plugins>
      <plugin>
        <groupId>org.apache.maven.plugins</groupId>
        <artifactId>maven-shade-plugin</artifactId>
        <version>3.2.0</version>
        <executions>
            <!-- Attach the shade goal into the package phase -->
          <execution>
              <phase>package</phase>
              <goals>
                  <goal>shade</goal>
              </goals>
          </execution>
        </executions>
      </plugin>
      <plugin>
        <groupId>org.apache.maven.plugins</groupId>
          <artifactId>maven-shade-plugin</artifactId>
          <version>3.2.0</version>
          <executions>
          <!-- Attach the shade into the package phase -->
            <execution>
              <phase>package</phase>
              <goals>
                <goal>shade</goal>
              </goals>
              <configuration>
                <transformers>
                  <transformer implementation="org.apache.maven.plugins.shade.resource.ManifestResourceTransformer">
                    <mainClass>logit.apm.testapp.App</mainClass>
                  </transformer>
                </transformers>
              </configuration>
            </execution>
          </executions>
      </plugin>
    </plugins>
  </build>
</project>
2. Configuring the App
In the same folder create a new file called config.properties and then open it with your text editor
Paste the following code into the file and then save the changes.
ENDPOINT=https://<your-otel-endpoint-address>
PORT=<your-otel-endpoint-https-port>
USERNAME=<your-otel-username>
PASSWORD=<your-otel-password>
Next, we need to navigate to the following folder:
src -> main -> java -> logit -> -apm -> testapp
Here you will find a file called App.java, this file will contain our app code.
Open the folder using your text editor and paste the following code:
package logit.apm.testapp;

import io.opentelemetry.api.GlobalOpenTelemetry;
import io.opentelemetry.api.OpenTelemetry;
import io.opentelemetry.api.trace.Span;
import io.opentelemetry.api.trace.Tracer;
import io.opentelemetry.sdk.OpenTelemetrySdk;
import io.opentelemetry.sdk.resources.Resource;
import io.opentelemetry.sdk.trace.SdkTracerProvider;
import io.opentelemetry.sdk.trace.export.BatchSpanProcessor;
import io.opentelemetry.exporter.otlp.trace.OtlpGrpcSpanExporter;
import io.opentelemetry.api.common.Attributes;
import io.opentelemetry.api.common.AttributeKey;
import io.opentelemetry.exporter.jaeger.JaegerGrpcSpanExporter;

import java.util.Base64;
import java.time.Duration;

import java.time.LocalDateTime;
import java.time.format.DateTimeFormatter;

import java.io.FileInputStream;
import java.io.IOException;
import java.util.Properties;

public class App {

    public static void main(String[] args) {

    // Define the service name as a resource attribute
    Resource resource = Resource.create(Attributes.of(AttributeKey.stringKey("service.name"), "LogitJavaTestApp"));

    Properties properties = new Properties();

    try (FileInputStream input = new FileInputStream("./config.properties")) {
            properties.load(input);
        } catch (IOException e) {
            e.printStackTrace();
        }

    String endpoint = properties.getProperty("ENDPOINT");
    String port = properties.getProperty("PORT");
    String username = properties.getProperty("USERNAME");
    String password = properties.getProperty("PASSWORD");
    String encodeBytes = Base64.getEncoder().encodeToString((username + ":" + password).getBytes());

    // Configure the OTLP exporter with basic auth
        OtlpGrpcSpanExporter spanExporter = OtlpGrpcSpanExporter.builder()
                .setEndpoint(endpoint + ":" + port) // Replace with your OTLP endpoint
                .addHeader("Authorization", "Basic " + encodeBytes)
                .build();

        // Set up the SDK tracer provider
        SdkTracerProvider tracerProvider = SdkTracerProvider.builder()
        .setResource(resource)
                .addSpanProcessor(BatchSpanProcessor.builder(spanExporter)
                        .setScheduleDelay(Duration.ofMillis(100))
                        .build())
                .build();

        OpenTelemetrySdk openTelemetrySdk = OpenTelemetrySdk.builder()
                .setTracerProvider(tracerProvider)
                .buildAndRegisterGlobal();

        // Get a tracer
        Tracer tracer = GlobalOpenTelemetry.getTracer("com.example.App");

        // Create a span
        Span span = tracer.spanBuilder("Logit Span Test").startSpan();

    LocalDateTime currentDateTime = LocalDateTime.now();
        DateTimeFormatter formatter = DateTimeFormatter.ofPattern("yyyy-MM-dd HH:mm:ss");
        String formattedDateTime = currentDateTime.format(formatter);

        span.setAttribute("First Message", "This is a test!");
    span.setAttribute("Second Message", "Message sent at " + formattedDateTime);

        span.addEvent("Test Log Event 1");
        span.addEvent("Test Log Event 2");

        span.end();

        // Shut down the SDK
        tracerProvider.close();

        System.out.println("App ran successfully");
    }
}
3. Run the Python App
Navigate back to the logit-apm-test-app folder, the folder that contains your pom.xml file using either the command prompt or terminal window.
Run the following command to build the project.
mvn package
As the project compiles the process and results are written to the command prompt or terminal window.
Still in the logit-apm-test-app folder, using the command prompt or terminal window, run the following command:
java -jar target/java-project-1.0-SNAPSHOT.jar
You will see that a message is returned to say that the app ran successfully.
The action of running the Java app will send traces to your Stack. You can now view these traces in Jaeger.
How to Visualize Java Traces in Logit.io
Viewing your Java traces in Logit.io is possible once you have configured Java to ship traces to Logit.io, which can be achieved by following the steps listed above or by using the instructions in the integration guide. To begin with ‘visualizers’ for Java traces we recommend using Jaeger as this can be launched from the ‘Application Performance Monitoring’ section.
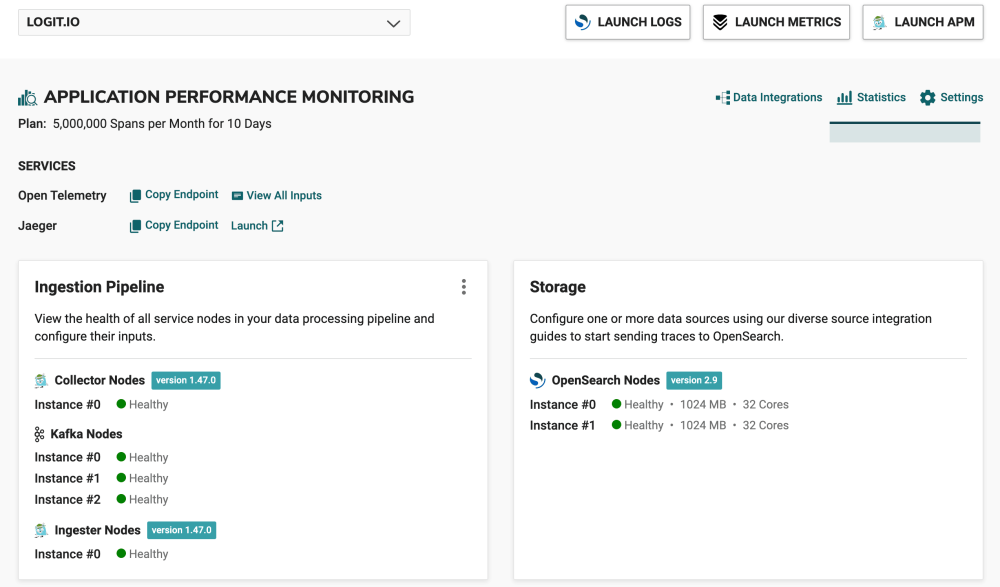
- Launch APM: From the initial dashboard, scroll down to the Application Performance Monitoring (APM) section, and under ‘Services’ you’ll see Jaeger, select ‘Launch’, or in the top right of your screen select ‘Launch APM’
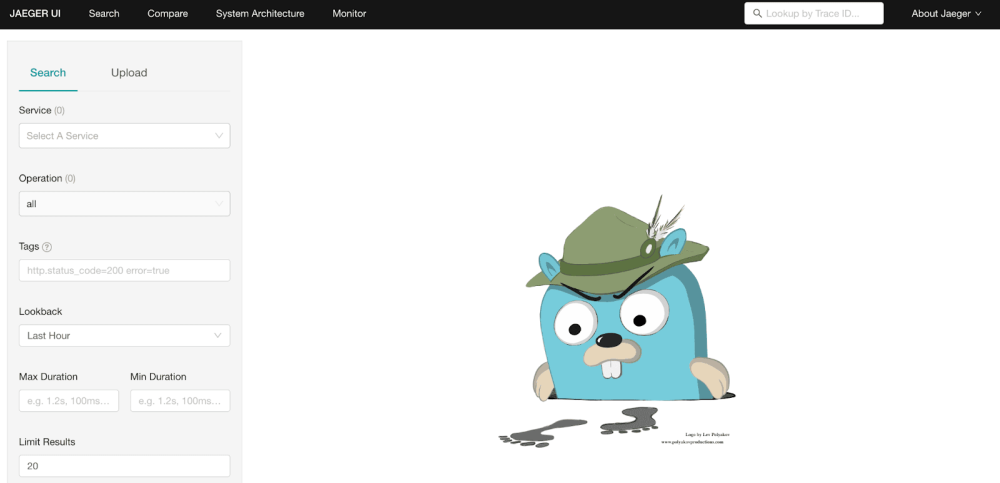
- Jaeger: After selecting ‘Launch APM’ or ‘Launch’ you will arrive at the Jaeger UI search page.
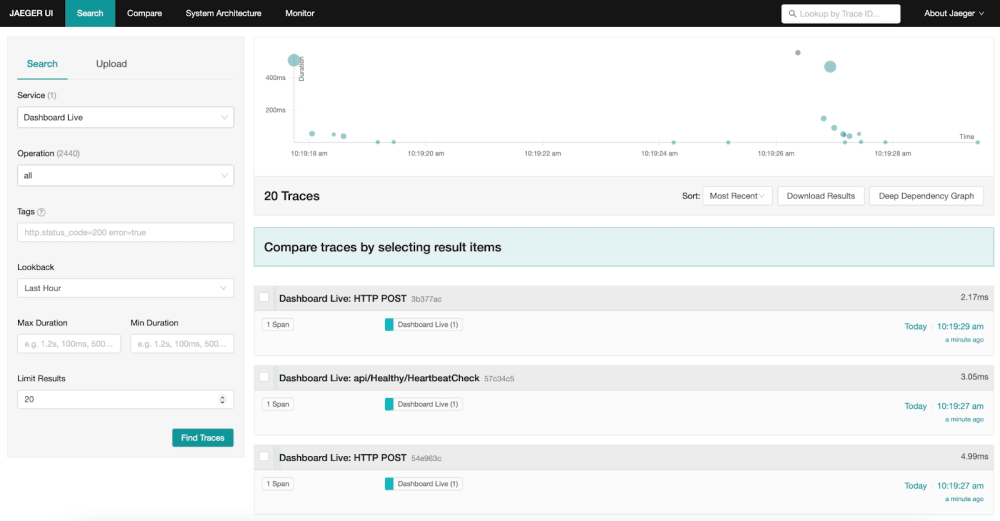
- Visualize Java Data: From this page, you can view all your ingested Java traces, Hosted Jaeger enables you to drill down into specific traces, view service dependencies, analyze latency distributions, and more, making it easier to pinpoint the root causes of performance issues.
If you've enjoyed this article why not read How to Integrate Python with Logit.io or How to Integrate Serilog with Logit.io next?