
Resources, How To Guides
7 min read
Last updated:
.NET is a popular developer platform that has been and continues to be used to design various types of applications. Ensuring that these .NET applications are running optimally and that you can identify issues before they escalate is critical. So to achieve this, numerous developers have turned to APM solutions like Logit.io. Within this article, we will outline how to integrate .NET traces with Logit.io for enhanced monitoring, troubleshooting, and analysis of your .NET applications, as well as provide an overview of .NET tracing and application performance monitoring with Logit.io.
Contents
What is .NET?
.NET is an open-source, fully integrated development environment from Microsoft and is used to create multiple types of applications, including web, desktop, mobile, cloud, gaming, and IoT. It features an excellent, uniform programming model coupled with a large class library that enables developers to build applications using different languages, like C#, F#, and VB.NET. Highly flexible, and scalable, with high performance, .NET supports several operating systems for development, including Windows, Linux, and macOS.
It’s an extensive platform comprised of the basic .NET runtime, which will execute the code, a rich framework of libraries and APIs for handling common tasks that include among others, networking, data access, the development of UIs, and development tools, such as Visual Studio, which streamline the coding, testing, and deployment processes. Everything .NET can offer, such as cross-platform support through .NET Core, integrated cloud services, and high-quality security, has made it a go-to technology stack in enterprise-level applications, microservices, and modern web development. It boasts an active community and large ecosystem where developers have extensive resources for building efficient, scalable, and secure applications.
.NET Architecture and Components
The .NET architecture is built around specific components that provide the infrastructure necessary for developing, running, and maintaining applications efficiently across different platforms.
Common Language Runtime (CLR)
At the heart of the .NET architecture is the Common Language Runtime, shortened as CLR, which acts like an execution engine for .NET applications. CLR manages the execution of programs and takes care of memory functions like garbage collection, exception handling, and thread management. Type safety, memory safety, and automatic memory management via garbage collection are some of the key features of CLR, which effectively rule out common mistakes such as memory leaks and dangling pointers. It enables code written in different languages, such as C#, F#, and VB.NET, to run on one platform through the compilation of source code into Intermediate Language (IL) that then gets compiled into native machine code by the Just-In-Time (JIT) compiler during execution.
Base Class Library (BCL)
The Base Class Library is an extended set of reusable classes and APIs that provide basic functionalities to the .NET applications. It offers a broad range of classes that implement various common tasks such as file I/O, data access, networking, collections, and data types. The fact that BCL is shared among disparate languages using .NET allows the developer to find familiar APIs, no matter what programming language they develop in. It simplifies application development by providing out-of-the-box modules that encapsulate common functionality, which enables developers to focus their work on the core of their applications.
.NET SDKs and APIs
.NET provides a vast collection of SDKs and APIs for various applications which are useful for developers. For example, ASP.NET can be used to develop the latest web applications and services, while WPF and Windows Forms can be used in constructing desktop applications with graphical user interfaces. Additionally, .NET provides the APIs for mobile development through Xamarin, enabling developers to create cross-platform native mobile apps running on iOS, Android, and Windows.
Cross-Platform Support
A key development in the .NET architecture is the cross-platform nature provided by .NET Core itself, now part of .NET 5 onward. It allows developers to build their applications or execute them on any operating system, whether it be Windows, Linux, or macOS. The cross-platform nature of .NET has been made more versatile and widely adopted with most cloud and containerized applications that require being deployed across diverse environments.
Managed Code and Interoperability
.NET is designed based on managed code, meaning that the CLR manages the execution of .NET applications and handles memory allocation, security, and error handling. However, .NET also supports the concept of unmanaged code by using a mechanism called Platform Invocation (P/Invoke) which can call native functions from DLLs/shared libraries. This ability to call lower-level system code or legacy applications written in languages like C or C++ enables interoperability between these systems.
ASP.NET and Web Development
.NET provides ASP.NET, which is a powerful platform for building modern web applications, APIs, and microservices. ASP.NET allows web development to be done on the server side and supports MVC and Razor Pages. It also enables Blazor, a framework for building interactive web UIs using C# instead of JavaScript. ASP.NET Core is a high-performance, cross-platform version of ASP.NET used to build scalable web applications and services, which also can be deployed in the cloud.
.NET Tracing
With .NET tracing developers can track the execution flow, log important events, and monitor performance metrics, this is essential for debugging and optimizing software. Trace support in the .NET Framework is primarily available through the classes in the System.Diagnostics namespace, which includes trace classes such as TraceSource, Debug, trace, and others. These classes provide functionality for authors to write trace messages to several outputs including the console, log files, or external listeners. The Trace and Debug classes are mainly used in development and testing to log vital information, with Debug targeted at debugging builds. On the other hand, TraceSource offers advanced tracing support, allowing a greater degree of fine-granularity in logging with distinct levels of severity such as Information, Warning, and Error.
Logit.io APM
Monitoring .NET applications can become complicated and time-consuming, especially when a server is running multiple applications simultaneously. By the time you've configured .NET to meet your requirements, valuable time that could have been spent on actual monitoring is already lost. Logit.io’s APM solution simplifies this process by allowing you to monitor and manage .NET applications straight out of the box. With our solution, you can track key performance metrics such as heap size, threads, and connections, ensuring the high availability and optimal performance of your Microsoft .NET applications.
Additionally, the Logit.io platform provides fully open APM and trace analytics with no vendor lock-in or data egress fees, along with clear and transparent billing that's easy to understand. If you’re interested in finding out more about Logit.io’s APM solution, feel free to contact us or begin exploring the platform for yourself with a 14-day free trial.
Unlock complete visibility with hosted ELK, Grafana, and Prometheus-backed Observability
Start Free TrialHow to Integrate .NET Traces with Logit.io
Integrating .NET traces into Logit.io for enhanced monitoring, troubleshooting, and analysis is simple through our detailed and easy-to-follow documentation. Our .NET configuration guide outlines how to ship traces from ASP.NET Core to Logit.io with OpenTelemetry. After following this integration guide, you’ll be able to view this data in Logit.io and begin conducting .NET application performance monitoring and .NET tracing.
Visualize .NET Traces in Logit.io
The Logit.io platform offers a range of open-source tools as hosted solutions, including Hosted Jaeger. With Hosted Jaeger, you eliminate the complexities of setting up Jaeger from scratch, such as configuring various components like agents, collectors, storage backends, and the UI. Additionally, Jaeger provides powerful visualization tools that enable interactive exploration of trace data. The solution is also highly scalable, efficiently managing large volumes of tracing data generated by distributed systems.
To visualize .NET traces in Logit.io, you first need to configure .NET to send data to Logit.io by following our configuration guide. For visualizing .NET traces, we recommend using Jaeger, which can be easily launched from the 'Application Performance Monitoring' section.
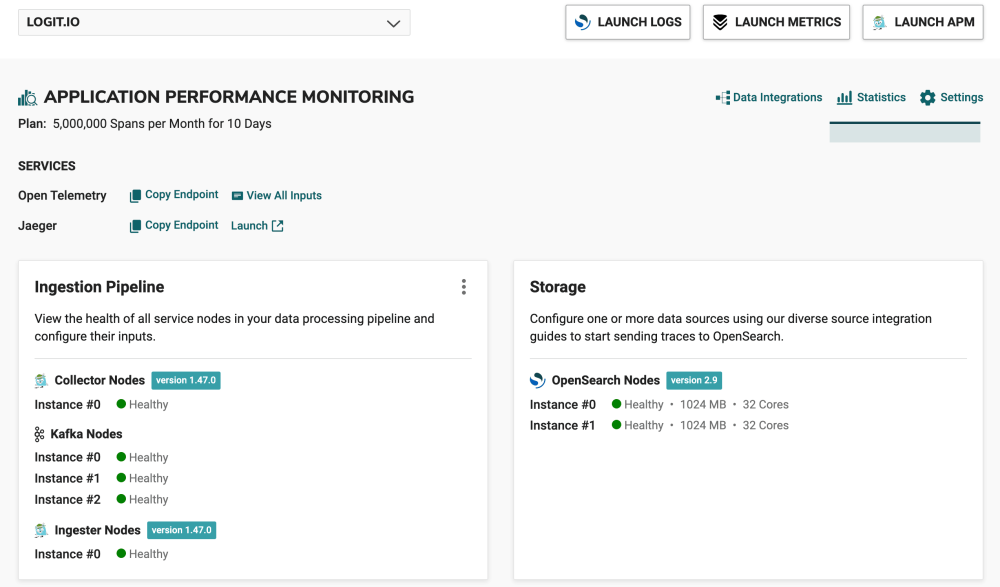
1. Launch APM: From the initial dashboard, scroll down to the Application Performance Monitoring (APM) section, and under ‘Services’ you’ll see Jaeger, select ‘Launch’, or in the top right of your screen select ‘Launch APM
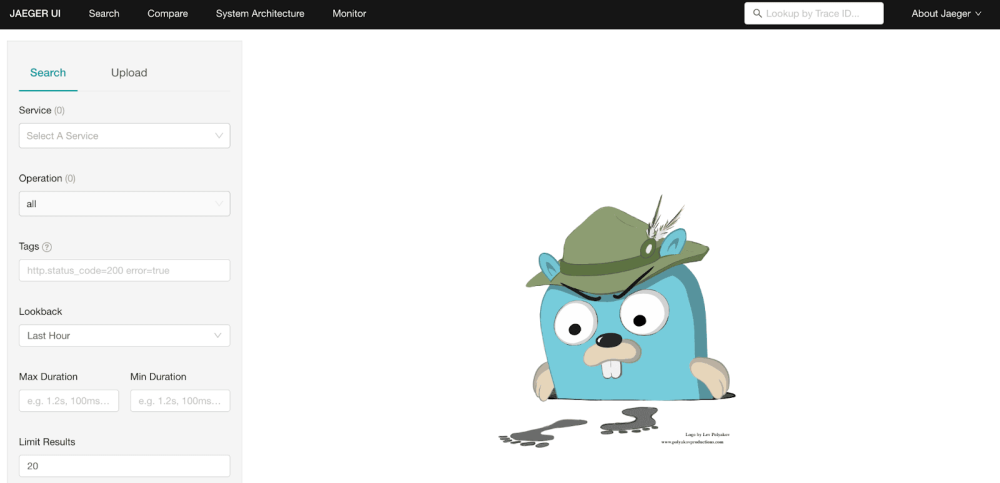
2. Jaeger: After selecting ‘Launch APM’ or ‘Launch’ you will arrive at the Jaeger UI search page.
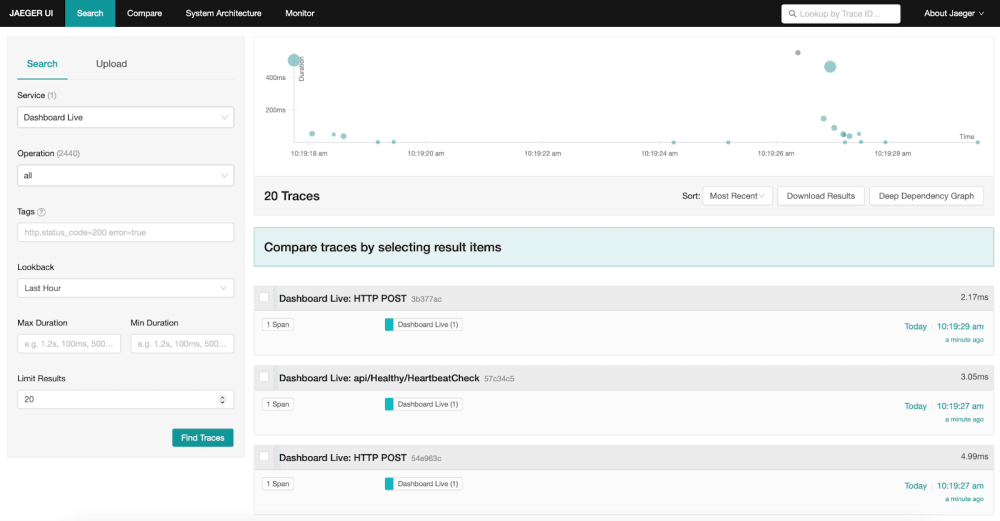
3. Visualize .NET Data: From this page, you can view all your ingested .NET traces, Hosted Jaeger enables you to drill down into specific traces, view service dependencies, analyze latency distributions, and more, making it easier to pinpoint the root causes of performance issues.
If you've enjoyed this article why not read How to Integrate .NET Logs with Logit.io or How to Integrate Java with Logit.io next?