
Resources, How To Guides
12 min read
Last updated:
Designed in the early 1990s Python was built to emphasize code readability and on the principle that there should be one way to do things. Python is one of the most popular programming languages and is utilized for a range of purposes including machine learning, web applications, and data analysis.
As a result of the popularity of Python, Python APM has become a crucial practice for numerous organizations. APM tools work by collecting and analyzing response times, throughput, error rates, and resource utilization metrics, which help to track application performance and health. This helps developers and system administrators locate performance bottlenecks, diagnose problems, and make sure that a Python application runs effectively when reaching a production environment.
Continuing with our series of how-to guides, this article will focus on how you can utilize Python with Logit.io, encompassing Python Application Performance Monitoring including crucial metrics to monitor, how to begin shipping Python traces to Logit.io, and how to visualize Python traces in Logit.io.
Contents
What is Python?
Python is a high-level, interpreted programming language known for its simplicity, readability, and versatility. It was designed to focus on code reliability and on the premise that there should only be one method for conducting things. In particular, Python’s versatility is one of the tool's most compelling features. It is a general-purpose language that can be used for anything from web applications and desktop GUI applications to data analysis, machine learning models, and even complex scientific simulations. This language extends with a vast standard library, with various modules and functions that can be used out of the box for all kinds of tasks. This reduces the need for third-party libraries and allows developers to accomplish more with less code.
Also, one of the reasons Python's popularity has grown is the strong community backing it. Over the years, Python has evolved, and today, it is one of the most extensive programming languages, advanced with rich ecosystems of libraries and frameworks like Django and Flask for web development, Pandas and NumPy for data analysis, and TensorFlow and PyTorch for machine learning. Thousands of third-party PyPI packages exist in the Python Package Index, which extends the capabilities beyond the basic Python install.
Python Application Performance Monitoring (APM)
Key Features of Python APM
- Real-Time Monitoring: Python APM tools, such as Logit.io’s APM solution, continuously monitor everything about the application in real time, from response times and error rates to CPU and memory usage, database queries, and much more. Real-time monitoring keeps them abreast of issues the very moment one emerges.
- Performance Metrics: APM solutions are designed to capture and analyze performance metrics like request latency, throughput, resource utilization, and error frequency. This set of metrics gives a deep understanding of the functioning of an application under diverse conditions.
- Transaction Tracing: Tracing is necessary as it enables you to follow the requests from the frontend to the backend while specializing services. This way, one can know what is slow or failing, dependencies, or the major root cause of performance issues.
- Error Tracking: Python monitoring tools are often combined with robust error tracking. They capture exceptions, errors, and stack traces with contextual information regarding where and why the error occurred, helping diagnose and solve bugs faster.
- Alerting and Notifications: Application performance monitoring tools, including Logit.io, can be configured to send alerts in the event of a breach of certain thresholds in their performance. For instance, when the response times are too big, or when the error rate increases suddenly. This proactive alerting helps the teams answer issues before they flare into major problems.
- Dashboards and Reporting: APM solutions show visual dashboards that monitor and display performance data in one place. These can also be customized, allowing teams to see critical KPIs at one glance. Reporting features assist in analyzing performance trends over time.
Advantages of Conducting Python APM
Firstly, a well-monitored Python application translates to a slick and fast user experience, something very critical in terms of user satisfaction and retention. APM tools help maintain the best possible performance of the application by detecting places where latency or errors could affect the end-user experience negatively. Because these are identified and quickly addressed, an organization can make sure its applications meet or even exceed user expectations for better customer loyalty and engagement. Also, it features watching activities and behaviors within the application by users to provide insight into how the user is interacting with the product for further improvement.
Additionally, Python monitoring tools work by offering a detailed insight into how your application performs at different levels. By tracking response times, throughputs, error rates, and resource utilization, developers and IT teams can maintain wide visibility into the health of an application. With deep visibility, users can detect the presence of bottlenecks, slow database queries, memory leaks, and other performance problems that will ultimately impact user experience. It allows you to drill down deeper into each transaction or request to a fine level, which is necessary for comprehensive optimization.
Moreover, Python APM solutions allow organizations to best optimize their infrastructure by tracking in detail the data on resource usage, such as services, CPU, memory, and operations on databases. By hypothesizing the data acquired, teams can find over, or under-utilized resources and adjust their infrastructure accordingly. Such optimization leads to efficient ways of using computing resources, which can incur significant costs, especially in any cloud environment where expenses are directly related to resource usage.
Lastly, APM tools for Python are built to address the complexity brought in by modern software architecture, such as microservices, distributed systems, and cloud-native applications. In particular, they offer monitoring and management capabilities across components and services for a unified view of the whole system. More importantly, it ensures that as applications scale and become more complex performance remains consistent and reliable even as the application grows.
APM from Logit.io
Logit.io offers a feature-rich and cost-effective application performance monitoring (APM) solution that excels at tracking Python applications. Our platform supplies fully open APM and trace analytics without vendor lock-in, or data egress fees, and displays transparent easy to understand billing.
Logit.io’s APM tool is built upon a backbone of open-source solutions. This includes the ELK Stack and Grafana as these both provide comprehensive log, metrics, and trace analytics features necessary for application monitoring and optimization. If you’re interested in finding out more about APM from Logit.io, feel free to contact us or start exploring the platform for yourself with a 14-day free trial.
Crucial Metrics to Monitor in a Python Application
Monitoring the right Application Performance Monitoring (APM) metrics is crucial for ensuring the performance, reliability, and user experience of Python applications. Below is a table of important APM metrics to monitor, why they matter, and what to look out for.
| Metric | Why It’s Important | What To Look Out For |
|---|---|---|
| Response Time | Response time is the duration for an application to process a request and send a response back to the user. Monitoring this helps find slow endpoints or services, which can directly impact user experience. | Consistently high response times or sudden spikes can indicate performance bottlenecks or issues in the application. |
| Error Rate | The error rate measures the percentage of requests that result in an error. This can indicate issues like unhandled exceptions, faulty logic, or dependency failures. | Tracking error trends over time can assist you in quickly identifying and addressing critical issues before they escalate. |
| Throughput (requests per minute) | Throughput measures the amount of requests your application handles per minute. This can show how much traffic your application is receiving and if it can handle the load. | Rapid drops in throughput can indicate a performance issue, while spikes could lead to overload and potential downtime. |
| CPU and Memory Usage | Monitoring CPU and memory usage helps ensure your application is efficiently using resources. High CPU or memory usage may lead to slow performance and potential crashes. | Consistent or rising CPU and memory usage over time, particularly during peak traffic, may indicate a need for optimization or scaling. |
| Database Query Performance | Slow database queries can impact application performance. Monitoring query execution times and the number of queries per request can identify inefficiencies in database interactions. | Long-running queries or a high number of queries per request can indicate a need for query optimization or indexing. |
| Cache Hit Rate | The cache hit rate measures the effectiveness of your caching strategy; it shows the percentage of requests served from the cache rather than the database. A high cache hit rate improves performance by reducing database load. | A low cache hit rate may indicate that your caching strategy is not operating as expected, leading to an increased load on your database. |
| Apdex Score | The Application Performance Index (Apdex) score measures user satisfaction based on response times, providing a simple way to gauge overall application performance from the user's perspective. | A low Apdex score suggests that users are experiencing slow or unsatisfactory performance. |
| Latency | Latency is the time it takes for a request to travel from the client to the server and back. It's often caused by network issues, server load, or inefficient code. | Tracking latency helps you find areas where the user experience might be degraded due to delays in processing. |
How to Use OpenTelemetry to Send Python Traces to Logit.io
You can find the full integration guide for using OpenTelemetry to ship Python traces to Logit.io within our documentation. Here, you can follow the detailed and informative instructions outlined to begin monitoring your Python traces in Logit.io, and gaining from numerous open-source tools as hosted solutions, facilitating effective analysis.
Opting for OpenTelemetry to send Python traces is beneficial for a multitude of reasons but a key factor is that it is automatically instrumented for numerous popular Python frameworks and libraries, which include Flask, Django, and HTTP clients. This way, you can begin capturing traces with minimal manual instrumentation, which minimizes the work required to do any activity in your application. This serves as useful if a developer wants to enable tracing quickly without going into the details of manual instrumentation.
Below we’ve listed the few steps that are essential to follow to begin sending Python traces to Logit.io for monitoring and analysis.
1. Install
Create a new directory for your project and name it opentelemetry_python_example.
Open a Terminal window or Command Prompt and navigate into the new opentelemetry_python_example folder. Create a virtual environment for your project to manage dependencies, this is done by entering the following command (below is the command for Windows for Linux/MacOS/DEB/RPM view the full integration guide.)
python -m venv venv
venv\Scripts\activate
We now need to install the necessary OpenTelemetry packages using pip, the packages that we will be using are as follows:
opentelemetry-api: Core API for OpenTelemetryopentelemetry-sdk: SDK implementationopentelemetry-exporter-otlp: Exporter to send data to the OpenTelemetry Collector or other OTLP-compatible backendsopentelemetry-instrumentation-flask: Automatically instrument your Flask applications for tracing with OpenTelemetry
We install them with the following command.
pip install flask opentelemetry-api opentelemetry-sdk opentelemetry-instrumentation-flask opentelemetry-exporter-otlp
Create two new files in the folder and call them app.py and config.py. There should now be a two files in the opentelemetry_python_example folder and a folder called venv.
2. Configure the App
Copy and Paste the code below into config.py.
# config.py

SERVICE_NAME = "LogitPythonTestApp"
OTLP_ENDPOINT = "https://<your-otel-endpoint-address>"
PORT = "<your-otel-endpoint-https-port>"
USERNAME = "<your-otel-username>"
PASSWORD = "<your-otel-password>"
Copy and Paste the code below into app.py
# app.py

import base64
from datetime import datetime
from opentelemetry import trace
from opentelemetry.sdk.resources import Resource
from opentelemetry.sdk.trace import TracerProvider
from opentelemetry.sdk.trace.export import BatchSpanProcessor
from opentelemetry.exporter.otlp.proto.http.trace_exporter import OTLPSpanExporter
from flask import Flask

app = Flask(__name__)

# Importing configuration variables from config.py
from config import SERVICE_NAME, OTLP_ENDPOINT, PORT, USERNAME, PASSWORD

def get_basic_auth_header(username, password):
    """Encodes the username and password to base64 for Basic Auth."""
    credentials = f"{username}:{password}"
    auth_bytes = base64.b64encode(credentials.encode('utf-8'))
    auth_header = auth_bytes.decode('utf-8')
    return f"Basic {auth_header}"

def init_tracer():
    # Create a Resource to associate with all traces
    resource = Resource.create({"service.name": SERVICE_NAME})

   # Set up the TracerProvider and add the OTLP HTTP exporter with Basic Auth
    tracer_provider = TracerProvider(resource=resource)
    trace.set_tracer_provider(tracer_provider)

  # Generate the Basic Auth header
    auth_header = get_basic_auth_header(USERNAME, PASSWORD)

   # Generate the full endpoint
   endpoint = f"{OTLP_ENDPOINT}:{PORT}/v1/traces"

   # Create the OTLP HTTP exporter with the Basic Auth header
    otlp_exporter = OTLPSpanExporter(
        endpoint=endpoint,
        headers={"Authorization": auth_header}
    )

   # Add the exporter to the tracer provider
   span_processor = BatchSpanProcessor(otlp_exporter)
   tracer_provider.add_span_processor(span_processor)

@app.route('/')
def hello_world():
    # Initialize the tracer
    init_tracer()
    tracer = trace.get_tracer(__name__)

   with tracer.start_as_current_span("parent-span") as parent_span:
       now = datetime.now()
       parent_span.set_attribute("FirstMessage", "This is a test!")
       parent_span.set_attribute("SecondMessage", "Message sent at " + now.strftime("%H:%M:%S"))

  # Start the second span within the first span
        with tracer.start_as_current_span("child-span") as child_span:
           child_span.set_attribute("FirstMessage", "This is another test!")

with tracer.start_as_current_span("hello-span"):
   return "Hello, World!"

if __name__ == '__main__':
    app.run()
3. Run the Python App
Run the Python app with the following command in the Terminal or the Command Prompt window.
python app.py
You will see feedback from the app so that you know that is running, make a note of the address and port that it is running on.
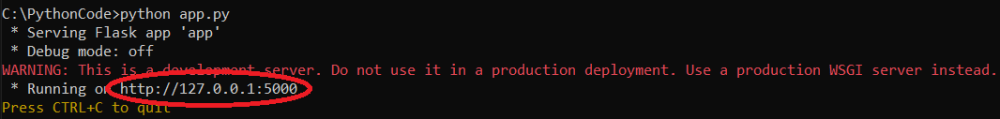
Open your browser and enter the address and port you made a note of in the previous step, the browser will return the following

The action of browsing to the page served by the Python app with sent traces to your Stack.
How to Visualize Python Traces in Logit.io
With the Logit.io platform, you gain access to a variety of open-source visualization tools as hosted solutions, including Grafana, Kibana, and Jaeger. This removes the complexities and time required to configure and maintain these solutions, enabling you to quickly begin focusing on what matters most to your organization, monitoring and guaranteeing the uptime of your applications.
In order to view your Python traces in Logit.io, you will need to have already configured Python to ship traces to Logit.io, which can be achieved by following the steps listed above or by using the instructions in the integration guide. To begin with ‘visualizers’ for Python traces we recommend using Jaeger as this can be launched from the ‘Application Performance Monitoring’ section.
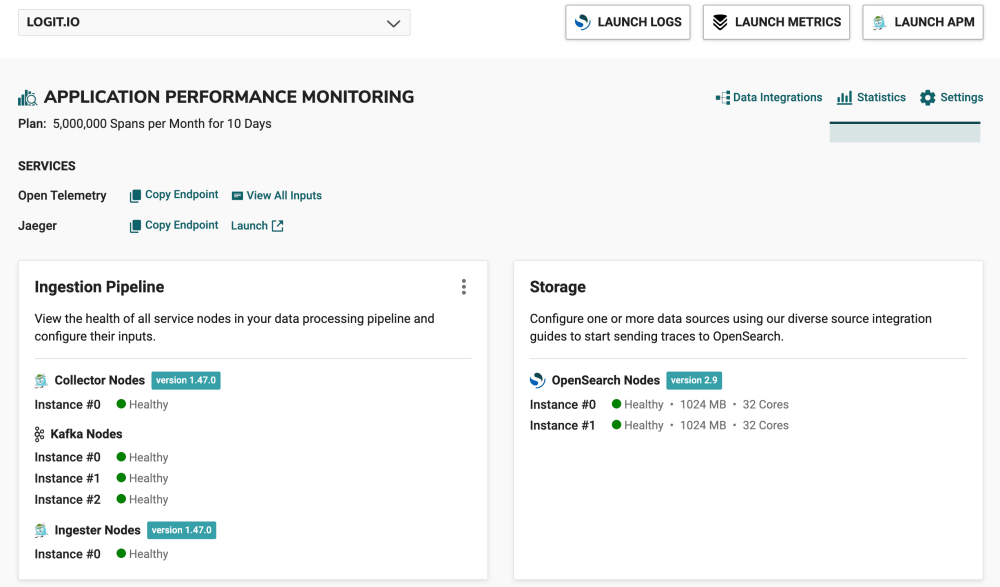
- Launch APM: From the initial dashboard, scroll down to the Application Performance Monitoring (APM) section, and under ‘Services’ you’ll see Jaeger, select ‘Launch’, or in the top right of your screen select ‘Launch APM’
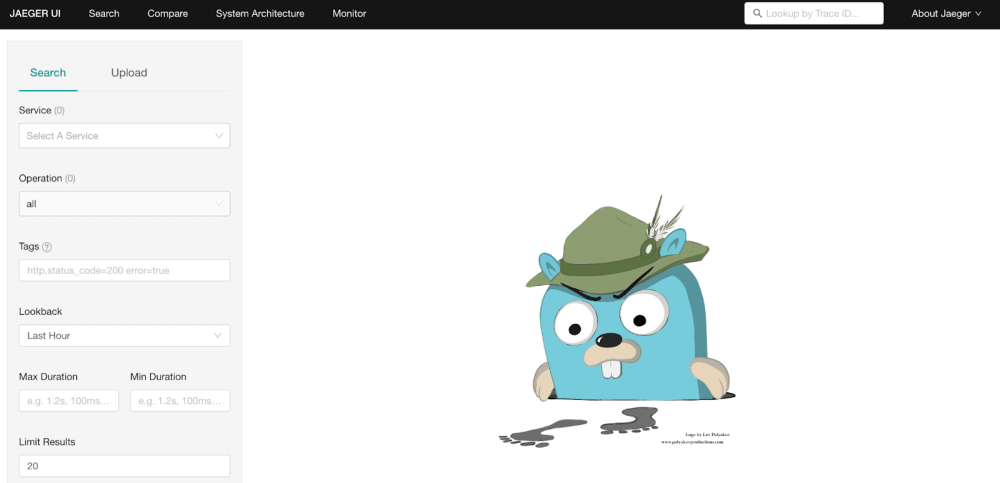
- Jaeger: After selecting ‘Launch APM’ or ‘Launch’ you will arrive at the Jaeger UI search page.
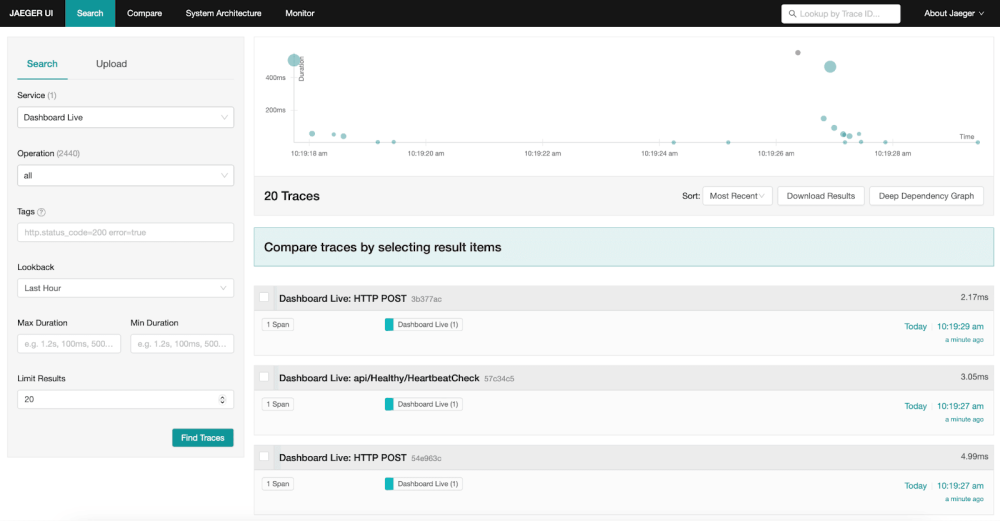
- Visualize Python Data: From this page, you can view all your ingested Python traces, Hosted Jaeger enables you to drill down into specific traces, view service dependencies, analyze latency distributions, and more, making it easier to pinpoint the root causes of performance issues.
If you've enjoyed this article why not read How to Integrate Serilog with Logit.io or Python Logging Best Practices next?