
How To Guides, Resources
8 min read
Last updated:
Rust has claimed the title of ‘most desired programming language’ for the past 8 years in a row in StackOverflow’s annual developer survey. The language was created less than 20 years ago, yet when users work with Rust, they always seem to want to work with it again. This consistent growth in popularity has, in part, driven the need for effective monitoring practices, particularly Rust tracing. To further comprehend Rust and Rust tracing, within this article, we will discuss what Rust is, the key features of the language, and common use cases, before outlining Rust tracing and how to integrate Rust with Logit.io for monitoring, analysis, and visualization.
Contents
What is Rust?
Rust is a modern, systems-level programming language that guarantees performance, memory safety, and concurrency. The language prevents common errors like null pointer dereferencing and data races, both particularly common in other systems languages like C and C++. Rust enforces memory safety without using a garbage collector through its ownership, borrowing, and lifetime mechanism for managing memory. Therefore, it’s ideal for creating high-performance applications, such as operating system development, game engines, and web services, where controlling the system resources and concurrency plays an important role.
Key Features of Rust
The popularity of Rust has grown due to the extensive features that the programming language offers, effectively combining a blend of performance, safety, and ease of use.
Borrowing and Ownership: One of the main distinctive features of Rust is its ownership model. The premise of an ownership model in Rust revolves around every value having a certain owner, and when the owner goes out of scope, the value will get dropped. Borrowing provides temporary access to values without taking ownership of them, hence ensuring safe and efficient memory management.
Memory Safety without a Garbage Collector: The ownership model of Rust guarantees memory safety without using a garbage collector. It prevents null pointer dereferencing, dangling pointers, and data races at compile time due to a set of strict rules imposed by memory usage through ownership, borrowing, and lifetimes.
Zero-Cost Abstractions: Rust has high-level abstractions, like traits and iterators, compiling down to efficient machine code with no performance overhead. Such abstractions enable developers to write more expressive, safe code without affecting performance.
Concurrency Without Data Races: Rust's concurrency model prevents data races at compile time because of its strict rules that describe how threads are allowed to access shared data. This allows the programmer to easily create safe and concurrent code, without the need for complicated locking mechanisms, making robust multi-threaded programs.
Pattern Matching: Rust offers a powerful feature of pattern matching that simplifies both control flow and error handling. Combined with the
matchkeyword using pattern matching on enums likeResultandOptionmakes it expressive to handle a variety of outcomes and conditions in a compact and readable way.Traits and Trait Objects: Traits represent a way of defining shared behavior across disparate types in Rust. They are similar to interfaces in other systems but also support some degree of generic programming. Trait objects provide one smart way to achieve polymorphism, making it easier to write code that can operate on different types.
What is Rust Used For?
Rust is used in a variety of fields and applications, particularly where performance, memory safety, and concurrency are critical. Firstly, one of the most fundamental use cases for Rust is in systems programming, whereby direct, low-level control over hardware resources is required. It is particularly fitted to operating system building, device drivers, and embedded systems in traditional areas dominated by both C and C++. Through its ownership model and the lack of a garbage collector, Rust's inherent memory safety features make it a much safer language to handle such system resources as memory and CPU.
Additionally, Rust is increasingly popular for compilation to WebAssembly (Wasm), a binary instruction format that enables high-performance code to run within web browsers. The ability of Rust to compile to Wasm turns it into a good choice for Web applications where heavy computation should be performed, for example, games, simulations, and real-time video/audio processing. With WebAssembly, Rust could realize near-native performance in the browser, opening new possibilities in Web development.
Another use case for Rust includes gaming development since it has significant power and control over memory. Game engines usually need fine-grained control over system resources and by having zero-cost abstractions and not having a garbage collector, Rust ensures that the performance will be smooth without sacrificing high-level productivity. Also, its concurrency features make it suitable for handling multi-threaded game logic efficiently.
Furthermore, the Rust ecosystem, driven mostly by the Cargo package manager, has made the process of writing command-line utilities and tools more accessible. Rust guarantees that such utilities, through its type system, are reliable and secure, which is why many would prefer using Rust in performance-sensitive applications needing complex handling, such as file processing, automation scripts, or data manipulation.
Lastly, Rust is increasingly used to develop operating systems and related components. For example, Redox OS is one operating system fully written in Rust, showcasing the potential of this language in replacing established languages like C in such areas. The memory security features in Rust make it especially appealing for writing an operating system's low-level, performance-critical code; such code also presents fewer security risks.
Tracing in Rust
Tracing in Rust involves capturing detailed information about code execution in modern, often distributed, applications, where requests span more than one service or component. Tracing lets you understand how a request flows through an application and provides a developer with what they require to identify precisely where performance bottlenecks or failures are happening, including where there is unusual latency.
Rust provides a tracing crate. A crate can come in two forms, binary or library, and it is the smallest amount of code that the Rust compiler considers at a time. This tracing crate records structured data that can be used for both debugging and performance monitoring making conducting distributed tracing much simpler, especially when paired with OpenTelemetry.
To perform Rust tracing, you will first need to instrument your application which can be achieved with OpenTelemetry. By doing this, the OpenTelemetry Collector will gather the instructed traces and send them to a platform for monitoring, like Logit.io.
Rust tracing enables developers to follow the flow of execution across various functions, threads, and services. In some cases, it offers minute details on how individual requests are flowing across a system. Such a granular level of information pinpoints bottlenecks, latency issues, or inefficiencies in distinct parts of an application. Also, full-path execution tracing helps developers understand how their code interacts with different components, making it easier to identify and resolve performance issues.
Also, third-party monitoring platforms, such as Logit.io, will include automated alerting and anomaly detection features for Rust traces. Defining thresholds for key performance metrics, such as latency or error rates, within the context of a platform that processes traces will be much easier to configure. Upon receiving a trace that has crossed the threshold, the monitoring system will automatically trigger alerts and facilitate the fastest possible response to incidents in their earliest stages. That will help prevent incidents from escalating and ensure teams are in a position to address problems proactively.
APM and Distributed Tracing from Logit.io
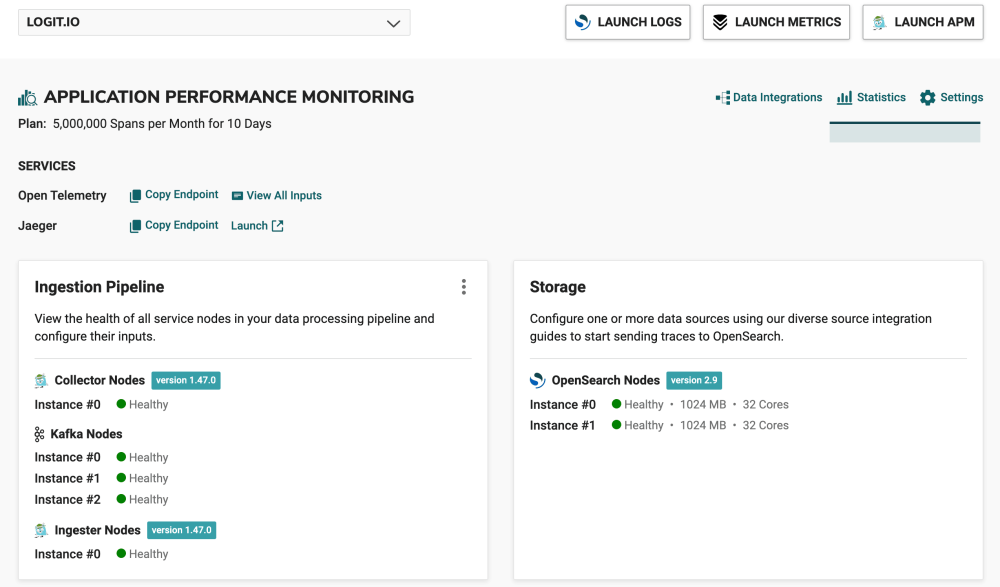
Logit.io’s cost-effective, powerful, and feature-rich APM solution provides distributed tracing facilitated by hosted Jaeger. With our observability platform, you can easily highlight, enhance, and monitor the performance of your applications and optimize your observability. From Logit.io’s main dashboard, you can access and view your Jaeger nodes and individual instances, as well as directly launch Jaeger.
Ensuring the security and compliance of a new solution is crucial, and Logit.io places this as a top priority. Our Hosted Jaeger solution is designed to meet security regulations, follow best practices, and comply with industry standards, ensuring that your trace data is securely managed and adheres to all relevant regulations. If you’re interested in finding out more about Logit.io’s APM solution with Hosted Jaeger, don’t hesitate to contact us or begin exploring the platform for yourself with a 14-day free trial.
Unlock complete visibility with hosted ELK, Grafana, and Prometheus-backed Observability
Start Free TrialIntegrating Rust with Logit.io
As part of Logit.io documentation, we offer a detailed configuration guide that outlines how to ship Rust traces to OpenSearch with OpenTelemetry. By using OpenTelemetry, the process of conducting Rust tracing in Logit.io is painless. OpenTelemetry reduces the manual effort in instrumenting applications with the help of automatic instrumentation libraries and a standardized telemetry framework.
Logit.io for OpenTelemetry is a secure, compliant, and production-ready distribution of the OpenTelemetry project, providing centralized management and unified analysis of all data types. By integrating OpenTelemetry (OTel) with Logit.io, you can achieve seamless end-to-end observability across your systems.
Visualize Rust Traces in Logit.io
Visualizing Rust traces in Logit.io is simple with hosted Jaeger. Hosted Jaeger from Logit.io completely removes the complexity and time-consuming tasks of configuring and maintaining the tool, as we will handle this. In addition, our expert engineers are available to share best practices tailored to your specific use case and they are ready to assist you at any stage while using Logit.io's Hosted Jaeger solution.
To visualize Rust and traces in Logit.io, you will first need to have configured Rust to send data to Logit.io by following the steps in our configuration guide. To start with ‘visualizers’ for Rust traces, we recommend using Jaeger which can be launched from the ‘Application Performance Monitoring’ section.
- Launch APM: From the initial dashboard, scroll down to the Application Performance Monitoring (APM) section, and under ‘Services’ you’ll see Jaeger, select ‘Launch’, or in the top right of your screen select ‘Launch APM
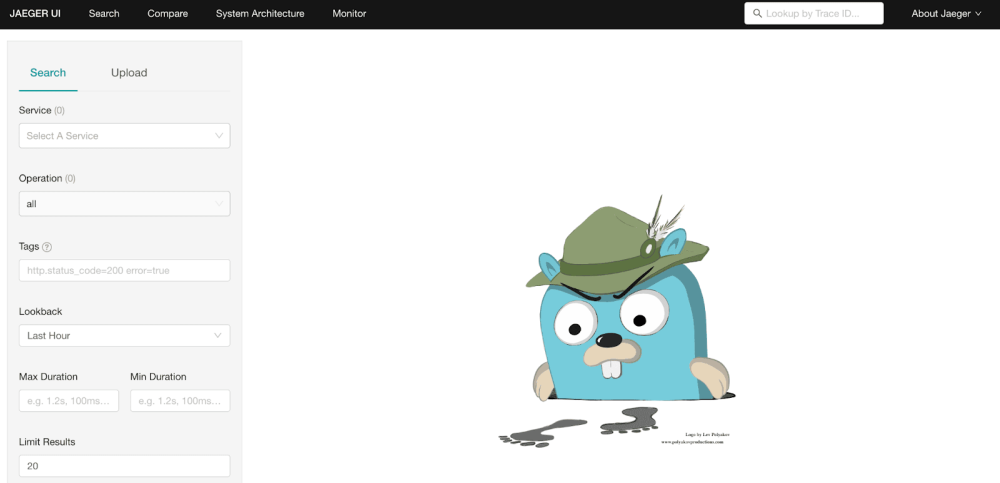
- Jaeger: After selecting ‘Launch APM’ or ‘Launch’ you will arrive at the Jaeger UI search page.
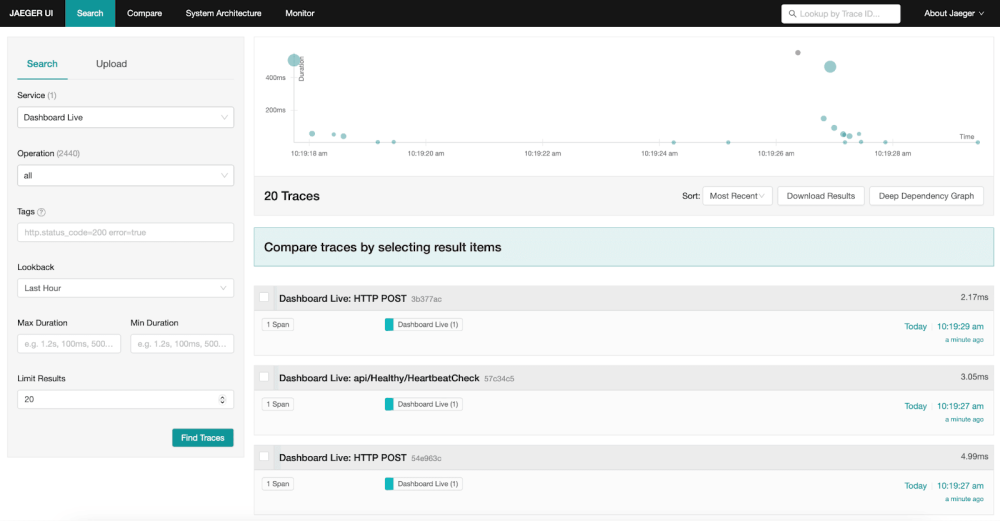
- Visualize Rust Data: From this page, you can view all your ingested Rust traces, Hosted Jaeger enables you to drill down into specific traces, view service dependencies, analyze latency distributions, and more, making it easier to pinpoint the root causes of performance issues.
If you've enjoyed this article why not read How to Integrate OpenTelemetry with Logit.io or How to Integrate Serilog with Logit.io next?