
Resources, How To Guides
7 min read
Last updated:
Serilog offers users a streamlined logging framework for .NET applications and cloud services. The tool enables users to adjust logging levels, enrich log events with additional properties, and switch between different sinks without modifying the application code. The simplicity of Serilog, its support of structured logging, and compatibility with asynchronous applications and systems are a selection of the tool's features that have led to it being commonly used across a variety of organizations.
Contents
What is Serilog?
Serilog is a simple-to-configure logging framework for .NET, with a clear API that supports a vast array of logging sinks. It has been designed with structured logging in mind enabling users to produce structured log events that can be written to a range of output sources such as text files and databases. It is a popular choice due to its simple, flexible, and extensible design.
Also, the solution is as useful in simple small applications as in larger complex ones and can be easily integrated, via extensions, with popular logging and monitoring tools such as Elasticsearch and Logit.io.
Why Is Serilog Beneficial For Structured Logging?
Log files are unstructured text data, making it difficult to query them for beneficial insights. Structured logging takes the contents of these log files and organizes them into a structured format that can be easily read, searched, and analyzed by any user or application. Commonly, JSON is the format of structured logging as it is the standard message format for each message parsing within applications and between systems.
Serilog lends itself to structured logging by encouraging users to log structured data as key-value pairs. By using this structured approach users attain enhanced analysis and filtering of log data, facilitating simple search, querying, and analysis of logs during debugging and troubleshooting. So, when an error occurs, structured logs can offer more context and details surrounding the error, simplifying the process of identifying the root cause and lessening the time taken to fix the problem.
Another method to understand why Serilog is beneficial for structured logging is to look at the alternatives, this would be NLog and log4net. Serilog is a newer tool than the other two, and while this isn’t always a good thing, in this case, it is. Due to Serilogs recent production it supports structured logging out-of-the-box whereas both NLog and log4net require configuration. In addition, Serilog offers much more up-to-date support in the community, leading to a vast number of extensions and logging sinks.
Lastly, structured logging with Serilog reduces redundancy and improves data organization, making it ideal for optimized storage. In contrast to traditional plain text logs, a structured log is one in which the data has a consistent structure and can easily be parsed and indexed by log management systems. This highly efficient storage format will have the benefits of low storage costs, high search performance, and supporting advanced querying capabilities. This way, structured logs enable log data to be parsed and visualized automatically on tools like Kibana or Grafana, making troubleshooting and monitoring so much easier.
How to use Serilog with Logit.io
Serilog can be enhanced with Logit.io by following a simple process. Logit.io’s powerful observability suite offers users increased visibility, monitoring, and analytic capabilities for their logs, metrics, and traces. With Logit.io Serilog logging and monitoring is straightforward and effective. View your logs and their details directly in the initial dashboard and launch OpenSearch dashboards for visualizations, providing in-depth analysis.
To begin Serilog logging and monitoring with Logit.io you will need to follow the steps outlined below to configure Serilog and start shipping logs to the Logit.io platform.
1. Install Serilog:
Install Serilog and add the Serilog and Serilog.Sinks.Network packages.
Install-Package Serilog
Install-Package Serilog.Sinks.Network
Install-Package Serilog.Settings.AppSettings
2. Configure Serilog:
Add AppSettings to your app.config or web.config.
<configuration>
  <appSettings>
    <!-- Level of logging -->
    <add key="serilog:minimum-level" value="Verbose" />
    <!-- Use the TCP Network sink -->
    <add key="serilog:using:TCPSink" value="Serilog.Sinks.Network" />
    <!-- Your logstash configuration -->
    <add key="serilog:write-to:TCPSink.uri" value="tls://your-logstash-host:<your-ssl-port>" />
  </appSettings>
</configuration>
The serilog:write-to:TCPSink.uri value must be in the format "protocol://domain:port".
3. Use Serilog:
Build a statically accessible Logger configured from AppSettings.
Log.Logger = new LoggerConfiguration()
    .ReadFrom.AppSettings()
    .CreateLogger();
You can now log from anywhere in your application.
Log.Information("The global logger has been configured");
4. Check Logit.io for your Logs:
Data should now have been sent to your Stack.
Visualize Serilog Data in Logit.io
The Logit.io platform incorporates the best in class open source tools as hosted solutions. This allows you to gain from Hosted Prometheus, Hosted Grafana, Hosted OpenSearch, and Hosted Kibana for all your visualization requirements.
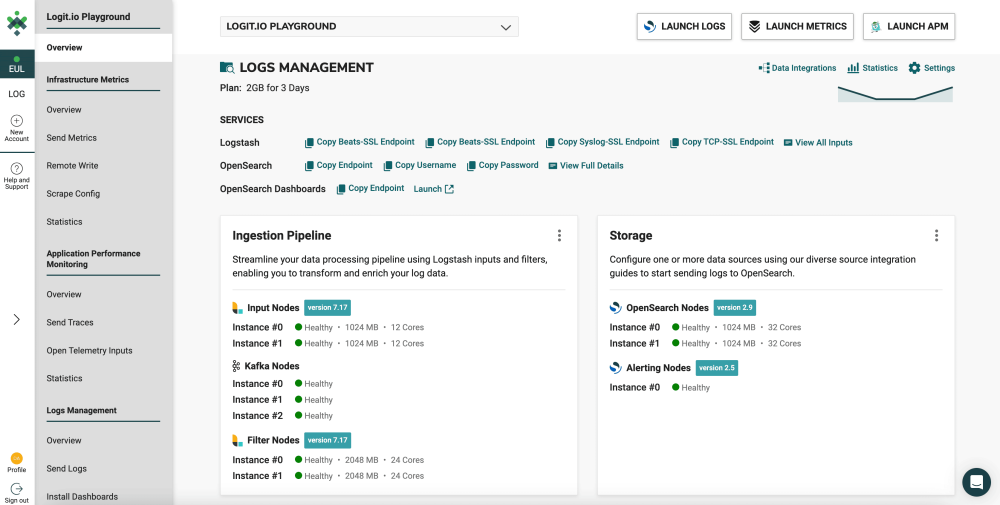
After configuring Serilog to ship logs to Logit.io, you can view your logs and the details of these logs from the initial dashboard. To begin with visualizers for Serilog logs, the recommended option is to utilize OpenSearch Dashboards which can be launched from the ‘Logs Management’ page.
- Launch Logs: From the initial dashboard, select ‘Launch Logs’ at the top right of your screen or ‘Launch’ next to OpenSearch Dashboards.
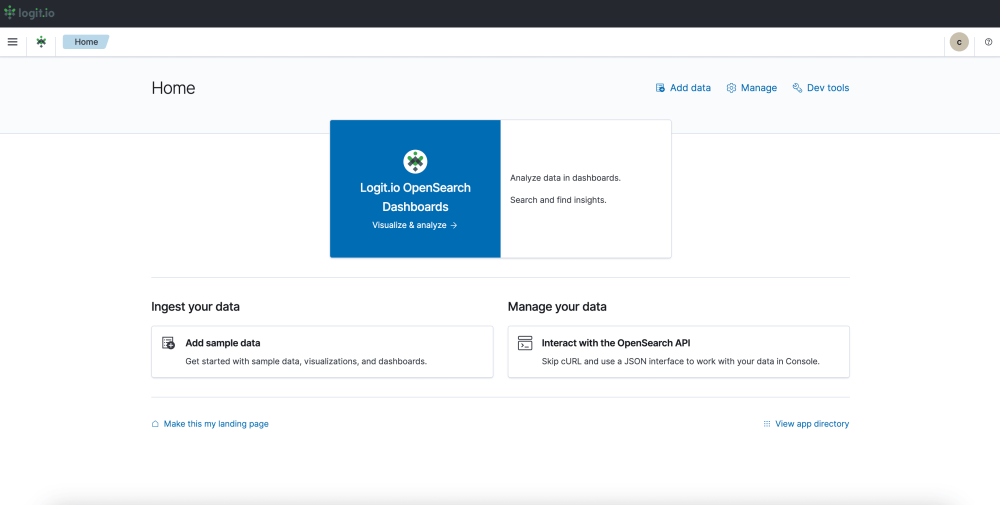
- OpenSearch Dashboards: After selecting ‘Launch Logs’ or ‘Launch’ you will arrive at the OpenSearch Dashboards welcome page. As you have already configured Serilog to ship logs to Logit.io, from here, select ‘Visualize & Analyze’.
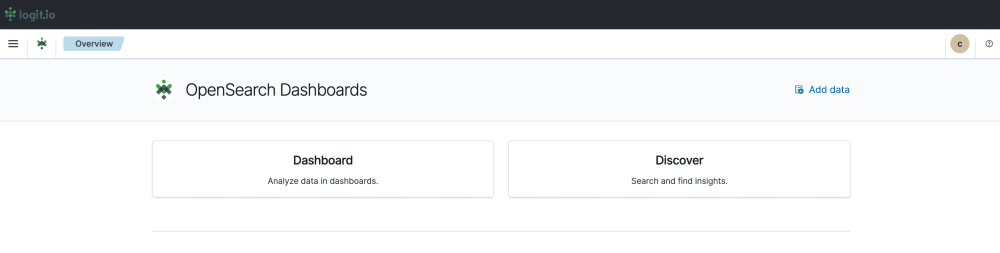
- Visualization Options: From this page, you can choose either ‘Discover’ which allows you to search through your data to find insights, or ‘Dashboard’ which allows you to analyze your data in dashboards. For this guide, we will select, ‘Dashboard’.
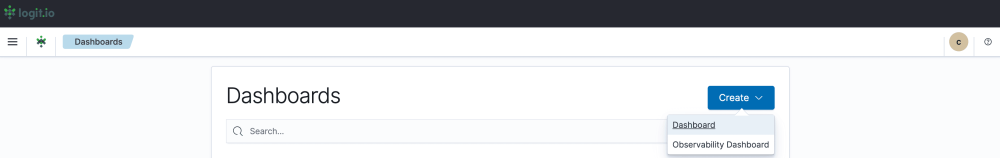
- Create a Dashboard: After selecting ‘Dashboard’ you now need to select ‘Create’ towards the right of your screen and ‘Dashboard’ from the dropdown menu.
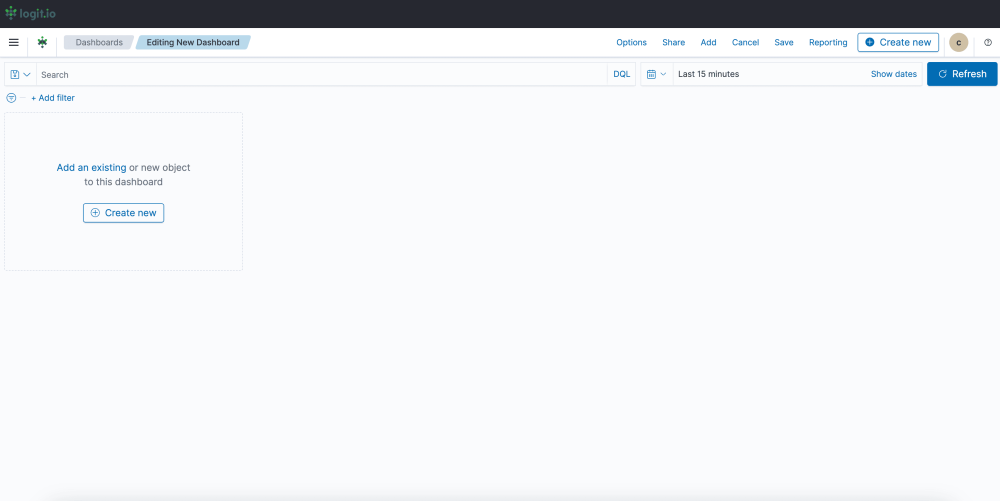
- Editing and Saving a Dashboard: From this page, you can edit your dashboard by adding existing panels and objects or creating new ones. To create a new object select ‘Create New’ from the left of your screen and choose your preferred data presentation type for viewing Serilog data. Once you’ve added all the objects you desire, click ‘Save’ in the top right. Now you can visualize your Serilog Data in Logit.io.
How To Alert on Serilog
Serilog does not natively support alerting capabilities, but Serilog can be integrated with other solutions, such as Hosted OpenSearch from Logit.io to provide alerting functionality. Utilizing alerts with Serilog enables you to conduct timely issue identification, proactive monitoring, and automated incident response.
Also, with Serilog, you can define granular alerting policies based on specific log event attributes, severity levels, or contextual information. This granularity enables you to differentiate between different types of issues and, correspondingly, set the alerting thresholds and actions to ensure optimum response and effectiveness from your alerting system.
Alerting with Serilog logging can empower your organization to proactively monitor, detect, and respond to critical events and issues within your applications, facilitating operational excellence, resilience, and agility in today's dynamic software environments.
To assist you in gaining the most from your Serilog configuration with Logit.io, we have outlined a few simple steps that enable you to begin using OpenSearch alerting for Serilog.
1. OpenSearch Plugin
Make sure the OpenSearch Alerting plugin is installed and enabled on your OpenSearch cluster. If not, follow the documentation to install and enable the plugin.
2. Define Alerting Conditions
In OpenSearch, you define the alert conditions according to your needs. You can set up alerting rules based on the content of the log message, severity level, frequency, or any other attributes available in the Serilog logs.
3. Create Alerting Monitors
Create alerting monitors in OpenSearch to match the defined alerting conditions. The monitors specify the conditions that will trigger the alerts, as well as the actions to be taken once the alerts are triggered.
4. Configure Actions for Alerts
Set up what happens when your alerts fire. Actions might include notification over e-mail, Slack, webhooks, or integration with other third-party services or incident management systems.
5. Test Alerting Rules
Test your alerting rules to ensure they are functioning as expected. Generate sample log events that match the defined conditions and verify that alerts are triggered correctly.
6. Example Configuration
Let's say you want to set up an alert that will fire whenever an error log is detected in your Serilog logs stored in OpenSearch.
Define Alerting Condition: Define a condition that specifies when an error log event occurs.
Condition: Log level is "error"
Create Alerting Monitor: Create a monitor in OpenSearch that uses the defined condition.
Monitor Name: Error Log Alert Condition: Log level is "error" Trigger: Threshold (e.g., trigger if there are more than 5 error logs in the last 15 minutes)
Configure Alerting Actions: Configure actions to be executed when the alert is triggered.
Action: Send email notification to [email protected]
Test Alerting Rule: Generate a sample error log event in your Serilog logs and verify that the alert is triggered, and the email notification is sent accordingly.
If you've enjoyed this article why not read Mastering Centralized Logging with OpenSearch or Centralized Log Management next?