
Resources
5 min read
Last updated:
InfluxDB is a powerful tool for managing time-series data. It is widely used in industries such as IoT, finance, healthcare, and more. Using InfluxDB, you can query and store large amounts of data in real-time, making it easier to identify patterns, trends, and anomalies.
InfluxDB dashboards provide a comprehensive overview of your system performance, metrics, and KPIs in real-time. You can customize these dashboards to meet your specific requirements. With this feature, you can choose what data you want to display, how it should be displayed, and how frequently it should be updated.
Chronograf, Grafana, and Kapacitor are some of the tools available for creating InfluxDB dashboards. These tools each offer their own set of features and functionality, so you can choose the one that best suits your needs.
This article explores some of the most useful InfluxDB dashboard examples. The examples we will explore include dashboards that monitor system performance, network traffic, and weather data.
You can use these examples to build your own InfluxDB dashboards, whether you are a novice or an experienced user.
Contents
- Virtualization Platform Monitoring
- System Monitoring
- Home Lab Metrics Measurement
- Amazfit Reporting Dashboard
- Raspberry PI Monitoring
- Synology Network Attached Storage (NAS) Device Reporting
- Veeam Virtualization Management Dashboard
- Monitor Solar Charge Controller Data
- Plex Dashboard
- Weather Monitoring
- Linux System Monitoring
- ZooKeeper
- Algorithmia
- Apache JMeter
- AWS Cloudwatch
- CSS Electronics
- Docker
- Elasticsearch
- Telegraf
- Prometheus
Virtualization Platform Monitoring

VMware vSphere is a virtualization platform developed by VMware. The technology allows multiple virtual machines (VMs) to run on a single physical server, effectively enabling multiple operating systems and applications to run simultaneously. For organizations looking to consolidate their IT infrastructure and reduce costs, VMware vSphere provides a complete virtualization suite, including network virtualization, storage virtualization, and resource management.
With vSphere, organizations can create virtualized environments that dynamically allocate and optimize resources such as CPU, memory, storage, and network bandwidth. As a result, organizations are able to improve their server utilization and increase the agility of their IT infrastructure.
Additionally, vSphere provides advanced features like high availability, fault tolerance, and vMotion to minimize downtime and ensure business continuity. Additionally, vSphere supports a wide range of guest operating systems, including Windows, Linux, and UNIX. Using InfluxDB alongside Telegraf, this dashboard displays CPU usage, network usage, and uptime statistics for virtual machines.
System Monitoring
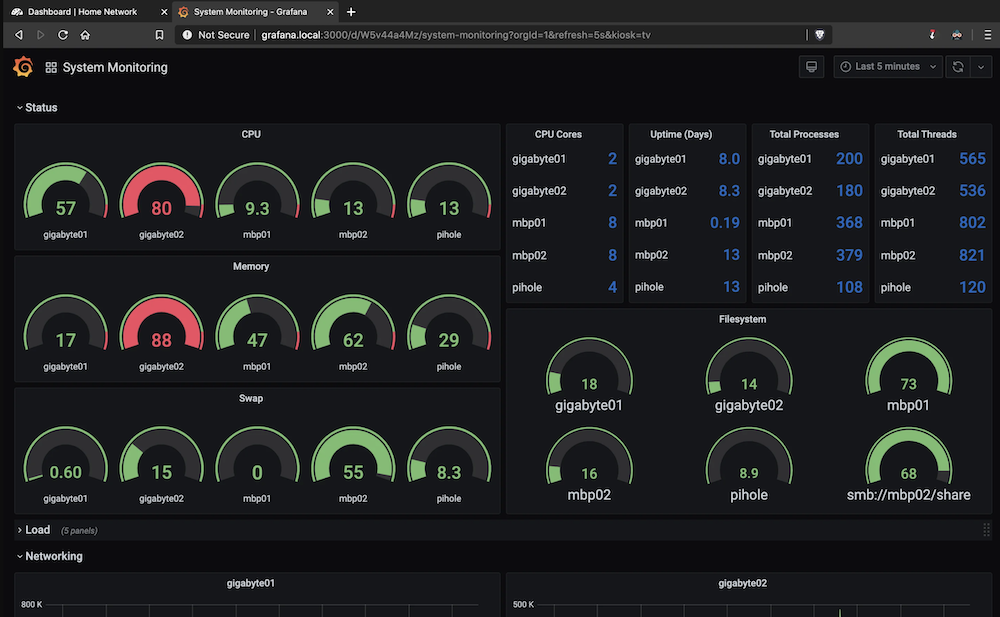
Because InfluxDB is specifically designed for storing and querying time-series data, which is a common type of data generated by systems and applications, it is a popular option for system monitoring. As well as being optimized for time-series data, InfluxDB provides fast query response times even for large datasets. In order to monitor and analyze the performance of the system in real-time, this is essential. Aside from InfluxDB, this dashboard also displays system monitoring metrics using Grafana and Glances.
Unlock complete visibility with hosted ELK, Grafana, and Prometheus-backed Observability
Start Free TrialHome Lab Metrics Measurement

As InfluxDB is designed to store time-series data, it is ideal for storing and analyzing data that changes over time, such as system metrics and sensor readings. Therefore, it's a great choice for homelab monitoring, where you might want to track CPU usage, memory usage, and network traffic. By using InfluxDB for homelab monitoring, you can keep your systems running smoothly and identify issues proactively before they become serious. A PRTG data source is used in conjunction with InfluxDB in this dashboard.
Amazfit Reporting Dashboard

When it comes to storing and analyzing data collected from Amazfit devices, InfluxDB is a great tool for storing and analyzing metrics such as heart rate, sleep data, activity data, and other sensor data collected over time by the devices. A great deal of different health metrics can be seen on this dashboard, which makes this an ideal template for anyone who wants to learn about themselves via biohacking.
Raspberry PI Monitoring

Due to the fact that InfluxDB is designed to be lightweight and efficient, it is a good choice for the Raspberry Pi or other low-power devices that require the use of a database. Additionally, InfluxDB can be configured to use a limited amount of disk space or memory, which helps to ensure that it does not overpower the resources you have available on your Raspberry Pi.
Synology Network Attached Storage (NAS) Device Reporting

As an advanced home user or small to medium-sized business owner, you might be familiar with the Synology DS918+ Network Attached Storage (NAS) device, designed to meet your requirements if you want a scalable and reliable storage solution. There is a wide range of applications included with the DS918+, including file sharing, backup and synchronization, multimedia streaming, and virtualization, as well as a user-friendly interface and the ability to integrate with Synology's DiskStation Manager (DSM) operating system. Using this dashboard, you will be able to monitor the status of the system fans, the capacity used, LAN traffic, and load vs temperature metrics.
Veeam Virtualization Management Dashboard

In addition to offering backup, disaster recovery, and virtualization management software, Veeam also delivers virtualization management solutions for VMware and Hyper-V virtualized environments. Cloud-based workloads, virtual machines, and physical servers can all be backed up and recovered with Veeam Backup & Replication. Additionally, Veeam offers products such as Veeam ONE for managing and monitoring virtual machines, Veeam Backup for Microsoft Office 365 for backing up and recovering Office 365 data, and Veeam Availability Orchestrator for orchestrating disaster recovery. It is possible to capture and display metrics related to virtual machines, storage quotas, sockets used, and managed physical workstations with the help of this dashboard.
Monitor Solar Charge Controller Data

With SolarThing, you can monitor and manage solar energy systems. Using SolarThing, you can monitor how much energy your solar panels produce over time. It can help you understand how much energy your panels produce at different times of the day, and how weather conditions affect your energy production.
In addition to providing information about when you are producing the most energy, SolarThing can also help you optimize your energy consumption. You can reduce your reliance on grid power and save money on your energy bills by shifting energy usage to times when your panels produce the most energy. Battery voltage, power usage, daily kWH, and various sensor metrics are displayed on this dashboard using InfluxDB.
Plex Dashboard

Plex is a media server and client application that lets users view and stream their personal media files at any time, from anywhere. With Plex, users can store their movies, TV shows, music, and photos on a centralized server and access them from any device with the Plex app installed, including smartphones, tablets, smart TVs, gaming consoles, and streaming devices like Roku and Apple TV. Using InfluxDB, this dashboard displays the number of songs, videos, and movies stored on the server.
Weather Monitoring
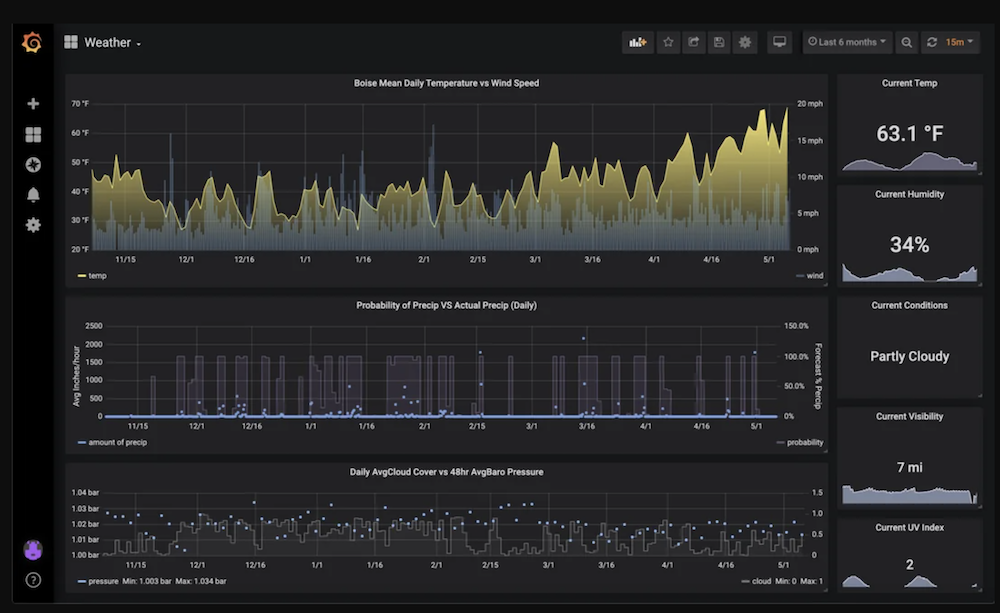
With its flexibility, scalability, and real-time monitoring capabilities, InfluxDB makes an excellent choice for weather monitoring, and it is widely used in industries where weather conditions can severely affect operations. The dashboard also uses Darksky and Python in addition to InfluxDB.
Linux System Monitoring

Accurately and effectively monitor your Linux systems with this InfluxDB dashboard. This dashboard provides an overview of your system and allows you to view specfic metrics such as system load, total memory, and system uptime, for further analysis and troubleshooting.
ZooKeeper

Apache ZooKeeper is a tool that assists users with developing and maintaining an open-source server that allows for highly reliable distributed coordination. In this example, the dashboard shown presents various ZooKeeper metrics such as update latency, connections rejected, and znode count.
Algorithmia

Algorithmia is an MLOps platform that possess' capabilities for data scientists, application developers, and IT operators to deploy, manage, and secure machine learning and other probabilistic models in production. With this InfluxDB backed dashboard you can visualize Algorithmia metrics with ease.
Apache JMeter

Begin effectively visualizing your Apache JMeter tests with this InfluxDB dashboard example. This dashboard makes it much simpler to analyze the performance of Apache JMeter tests by monitoring metrics such as request count, number of hits, and user count.
AWS Cloudwatch

By utilizing the AWS Cloudwatch service you can begin visualizing your AWS EC2 ELB data in real-time. The dashboard example shown provides an overview of your AWS instances and presents metrics including but not limited to CPU credit balance, CPU utilization, and status checks.
CSS Electronics

CSS Electronics provide products that allow the user to log CAN data for vehicles. This CAN data is being utilized in this dashboard for a specfic truck and presents useful metrics for logistics such as engine speed, oil temperature, and brake pressure.
Docker

For Docker users, as InfluxDB is able to handle real-time monitoring, users can more effectively monitor Docker containers and promptly react if any issues arise. With this dashboard example you can monitor metrics such as CPU usage per container, memory usage per container, and the overall number of Docker containers.
Elasticsearch

Elasticsearch is a well-known search and analytics engine which is based on Apache Lucene. This dashboard enables you to monitor metrics such as memory, nodes, and cluster status, all key metrics worth measuring to ensure uptime of your ELK Stack.
Telegraf

Telegraf is an open-source server agent that assists in the collection of metrics from technology stacks, sensors, and systems. This dashboard created with InfluxDB presents data from the Telegraf service to clearly reflect issues such as errors and outputs generated.
Prometheus
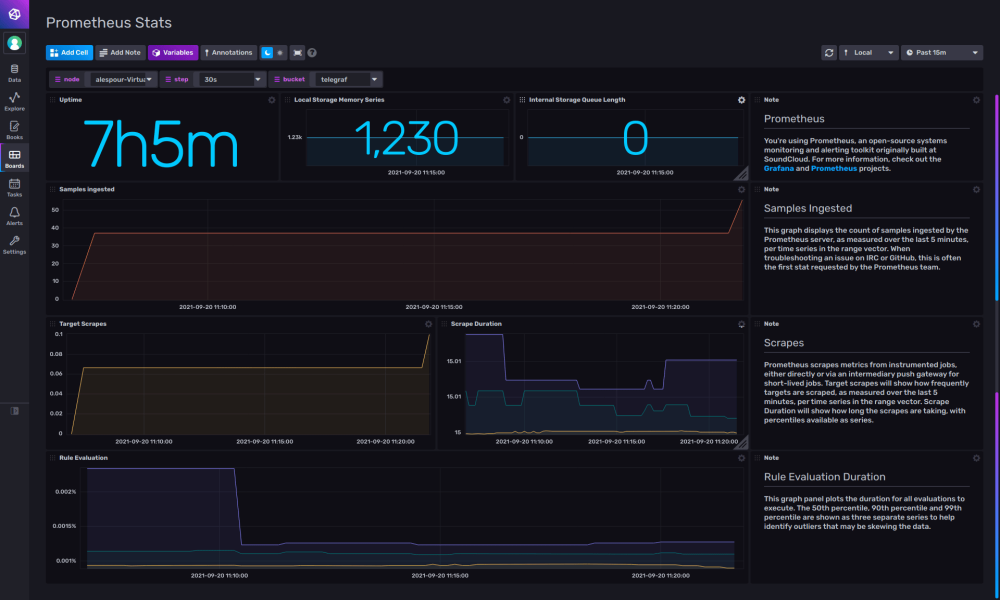
Our final InfluxDB dashboard example is for Prometheus monitoring. Prometheus is an opn-source toolkit that records metrics in a time series database built using an HTTP pull model. With this dashboard you can view a range of metrics including but not limited to uptime, samples ingested, and scrape duration.
If you found this article interesting then why not read open source SIEM or all about OpenSearch vs Elasticsearch next?