
Resources
8 min read
Last updated:
In our latest comparison guide for 2023, we'll cover all of the best IT infrastructure monitoring software that you should consider using to maintain uptime and improve your system’s performance.
Contents
1. PRTG Network Monitoring
Using PRTG Network Monitor, you can monitor networks, virtual machines, servers, and applications for extensive infrastructure monitoring. Besides agent-based monitoring, it also provides agentless monitoring. The metrics information collected by agentless monitoring is collected using technologies like WMI, SNMP, SSH, and NetFlow.
For high-level visibility, PRTG has a dashboard integration that lets you see alerts, outages, and warnings all at once. Infrastructure capacity monitoring allows you to identify bottlenecks and monitor capacity over time, which can be helpful for long-term planning.
Key Features:
- Centralised management console
- All-in-one monitoring solution
- On-premise service
2. ManageEngine
With ManageEngine's EventLog Analyzer, users can improve their application performance and troubleshoot problems more easily. In the past, the platform has been criticized due to the appearance of a somewhat dated user interface and the platform’s inability to provide seamless platform upgrades.
With the ManageEngine logging solution, you can monitor networks, physical and virtual servers and storage devices, in real-time. Using ManageEngine's EventLog Analyzer, you can also view log data instantly. The platform also tracks all data access permissions and ensures the integrity of stored data.
Key Features:
- Management of application logs
- Syslog viewer
- Tracing transactions
- Data mapping
3. Logit.io
Logit.io delivers a highly affordable infrastructure monitoring solution that makes it possible to maintain the uptime and high availability of your services and applications. Your enterprise data is fully protected with Logit.io's high-level availability, service level agreements (SLAs) available up to 99.9999% and their utmost adherence to leading compliance standards.
Using Logit.io as a monitoring and alerting service, you are fully able to monitor and respond in real-time to a wide range of metrics and log events. Capterra, Software Advice, and Gartner have all five-star reviews in support of the Logit.io platform.
Key Features:
- Monitor private, public and hybrid-cloud
- Natively correlate your infrastructure
- OpenTelemetry (OTel) Support
- Pre-configured Dashboards
- Monitor metrics, logs and traces
- A single centralised platform
4. Zabbix
Zabbix's open-source monitoring tool collects and displays network, server, virtual machine, and cloud service metrics. In addition to the many benefits Zabbix provides to potential users, it is also worthwhile to consider the feedback left on software engineering forums. This feedback often mentions drawbacks, such as the excess time required to customize templates and settings configurations.
In addition to supporting multiple operating systems (including Windows, Linux and Unix), Zabbix also gathers key metrics such as CPU, memory, and network usage. In addition to the services out-of-the-box templates, you can develop your own custom templates if required. Subsequently, the service can be configured to send alerts via email, SMS and webhooks based on user-defined triggers.
Key Features:
- Extract Prometheus exporter data
- Run on-premise or in the cloud
- Conduct root cause analysis
- Schedule metric collection
5. Datadog
Datadog is a popular monitoring tool for networks, applications, and logs. This well-known platform supports a wide range of useful features and can be configured and reported according to the specific needs of engineers. Datadog also offers a variety of native integrations and user customizations that make it an incredibly powerful tool. In addition, Datadog can readily leverage and process OTLP telemetry data.
Key Features:
- Monitor application performance
- Cloud observability
- Serverless
- CoScreen
6. Sematext
By using Sematext, you can gain visibility into containerized applications that are running on the Kubernetes, Docker Swarm, or Nomad orchestration platforms. Using the platform allows users to streamline the process of collecting all the data about the host and the containers in one convenient location. The dashboards in Sematext can be completely tailored to the needs of technicians and systems administrators. With this platform, you can easily view alerts and logs in one place as well as set alerts for any metric by clicking the alert icon next to it within the Sematext dashboard.
Key Features:
- Log Monitoring
- Server Monitoring
- Kubernetes Monitoring
- Alerting
7. Dynatrace
Using Dynatrace's cloud monitoring and error resolution tool, engineers can simplify troubleshooting and error resolution for cloud environments. Monitoring your infrastructure across cloud, on-premises, and hybrid environments are made easier when using Dynatrace. By enabling the infrastructure monitoring mode, you can also customize the Dynatrace agent to monitor physical and virtual infrastructure. Dynatrace is available as a hosted SaaS or hybrid cloud service, the service can also monitor CPU, memory, storage, NIC metrics, host processes, network health, and VMware virtualization.
Key Features:
- Cloud and virtual machine monitoring
- Server-side service monitoring
- Automated entity modelling
- Infrastructure monitoring
- Real User monitoring
8. New Relic
More than 10,000 companies around the world use New Relic to track distributed traces and monitor browsers, infrastructure and synthetics. With New Relic, you can view the performance of all the components of your infrastructure. Using the platform you can also monitor logs, infrastructure, applications, serverless functions, and more from a single tool instead of switching between different applications (which often leads to tool sprawl). In addition, the insights feature of New Relic lets you easily track and query infrastructure monitoring data.
Key Features:
- Querying without limits
- Open data collection
- On-host Integrations
- Synthetics checking
- Dynamic alerts
- Dashboards
9. Sysdig
With Sysdig Monitor, users can get a high-level view of containerised operations and further visibility into Kubernetes. Sysdig recently announced plans to support a number of Cloud Native data sources along with preconfigured dashboards and monitors. Sysdig’s Infrastructure as Code security scans are able to scan Terraform templates for misconfigurations and can be used by Terraform to simplify the deployment of Sysdig for the cloud.
Key Features:
- Container & Kubernetes Security
- Infrastructure monitoring
- Collect custom metrics
- IaC Security
- CIEM
10. LogicMonitor
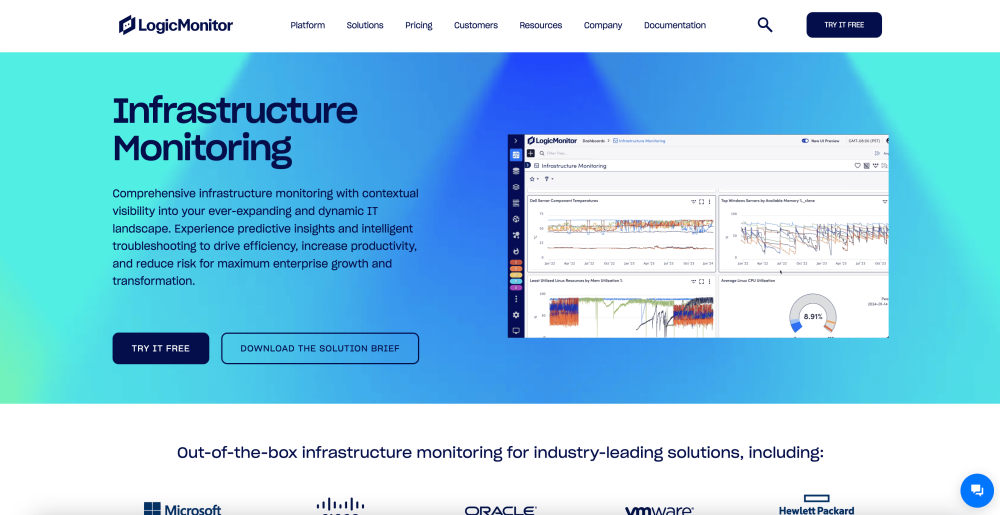
With LogicMonitor, automated observability is centred around monitoring data centres. The log visualisation feature in LogicMonitor allows you to analyze log files from various sources, including OS, MySQL, Tomcat and others. The platform allows MSPs and enterprise-level clients to fully monitor complex IT environments in an automated hybrid environment.
Key Features:
- Infrastructure Monitoring
- Remote Monitoring
- APM
11. Nagios
Nagios offers various solutions that can monitor your entire IT infrastructure, including operating systems, multiple network protocols, services, applications, and systems metrics. With Nagios you can utilize dashboards, alerting and extendable architecture to deepen your monitoring and analysis.
12. Icinga
With Icinga's infrastructure monitoring solution you can acquire a full-stack monitoring solution that provides complete visibility. Icinga's solution is comprehensive and includes network monitoring, server monitoring, and application monitoring, to guarantee full observability of your entire IT infrastructure.
13. SigNoz
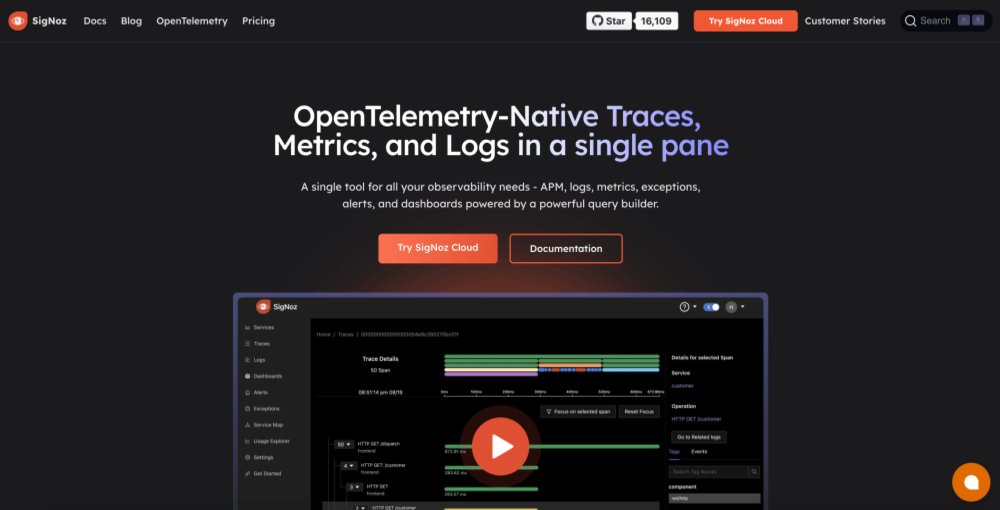
SigNoz aims to provide a single tool for your complete observability needs. This solution is fully integrated with OpenTelemetry, making it easier to send and ingest data. Also, ingestion and aggregations are faster as a result of SigNoz utilizing Clickhouse, a distributed columnar database.
14. Checkmk
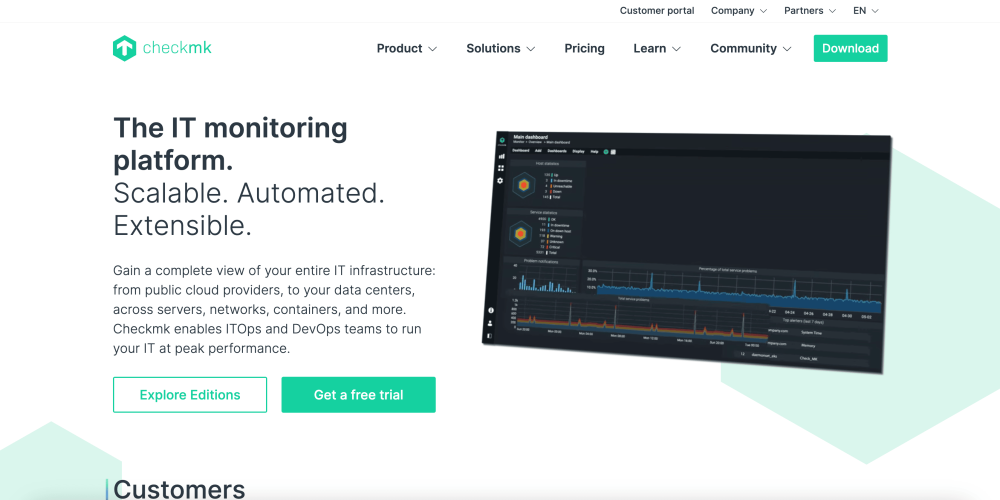
Checkmks platform provides you with complete visibility of your entire IT infrastructure. You have the choice of three products, Checkmk Cloud for cloud and hybrid infrastructures, Checkmk Enterprise for enterprise-wide IT monitoring, and Checkmk Raw offers free and open-source IT monitoring. Checkmk's platform has extensive monitoring capabilities with over 2,000 vendor-maintained monitoring plugins.
15. Graphite

For a simple open-source infrastructure monitoring solution that performs well on both cheaper hardware or across cloud infrastructure, then Graphite is an ideal option. With Graphite, you can monitor the performance of your websites, applications, business services, and networked servers. It's important to note that Graphite only stores numeric time-series data and renders graphs of this data on demand, it is not a collection agent.
16. Netdata
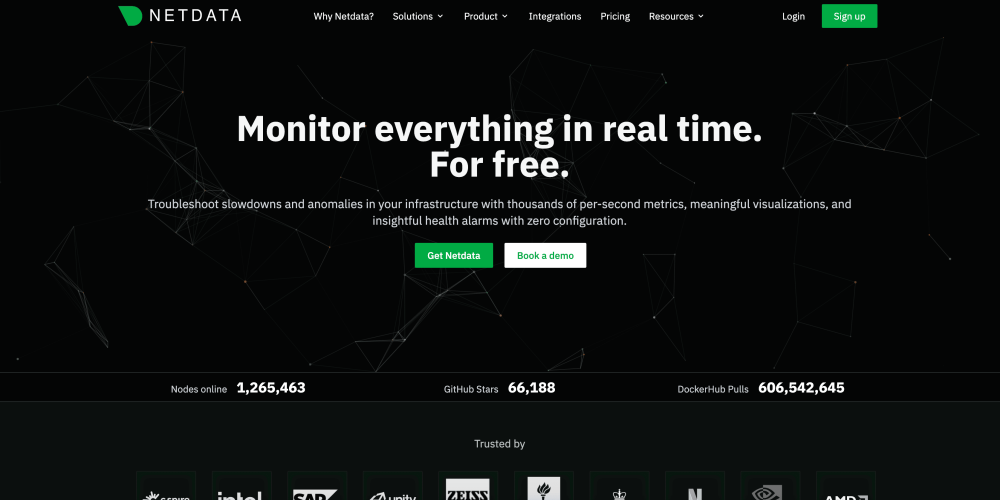
Netdata offers infrastructure monitoring as an open-source solution or as closed sourced software. Netdata collects, stores, queries, visualizes, sets up alerts as well as incorporate the training of machine learning models for your entrire IT infrastructure. Also, you can begin monitoring almost instantly as their installation is quick and simple.
17. Insight Cat
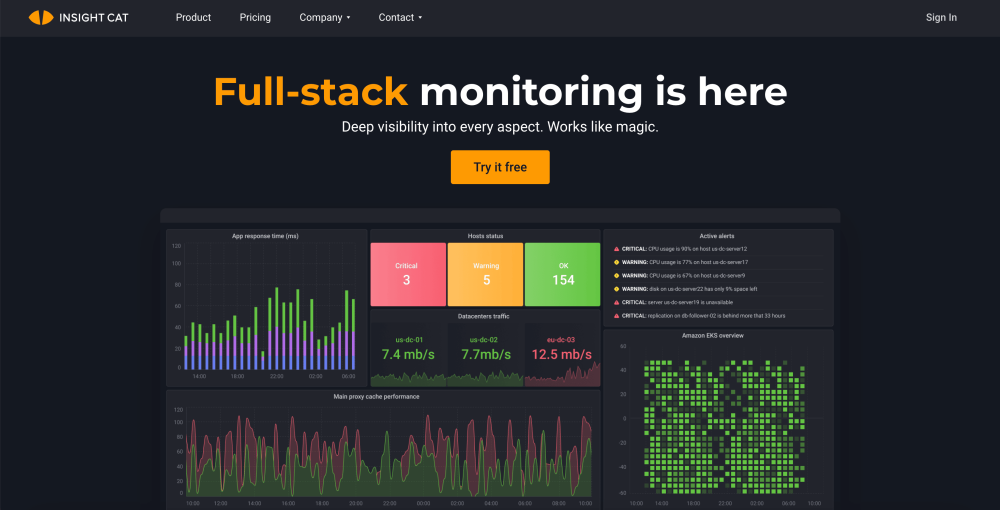
With Insight Cat you can gain insights into your IT infrastructure by conducting full-stack monitoring with high visibility into every aspect. The solution includes numerous integrations and you can bring your own infrstructure. For example, input one line to your telegraf.conf and start attaining real-time insights and smart alerts for your infrastructure.
18. Middleware
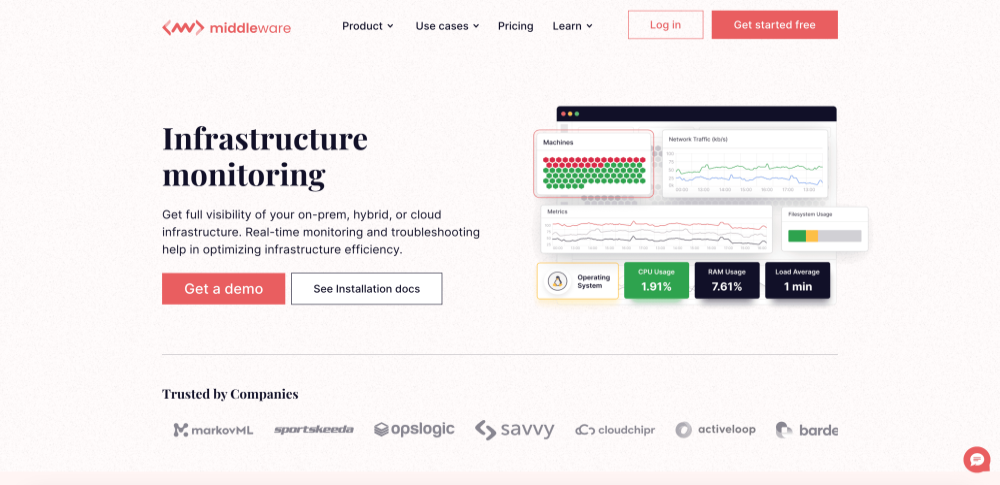
Middleware offers a AI-powered infrastructure monitoring platform that can assist you in identifying, understanding, and fixing issues across your cloud infrastructure. The platform is lightweight. Also, AI will find all the issues from infra and application and provide improved recommendations on fixing them.
19. SolarWinds
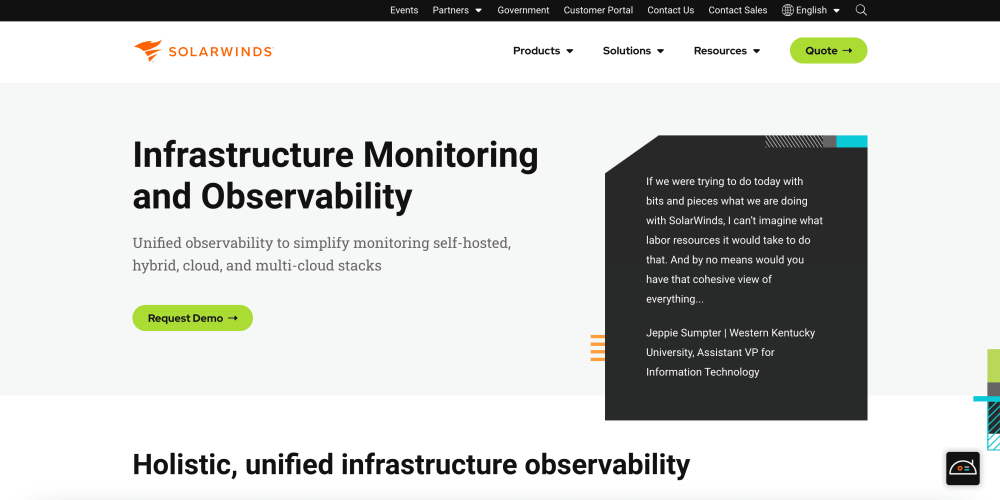
Combining observability with infrastructure monitoring, SolarWinds solution simplifies the monitoring of self-hosted, hybrid, cloud, and multi-cloud stacks. SolarWinds infrastructure monitoring offers interactive topology maps and continuous auto-discovery to help streamline managing complex and dynamic IT environments.
20. AppDynamics
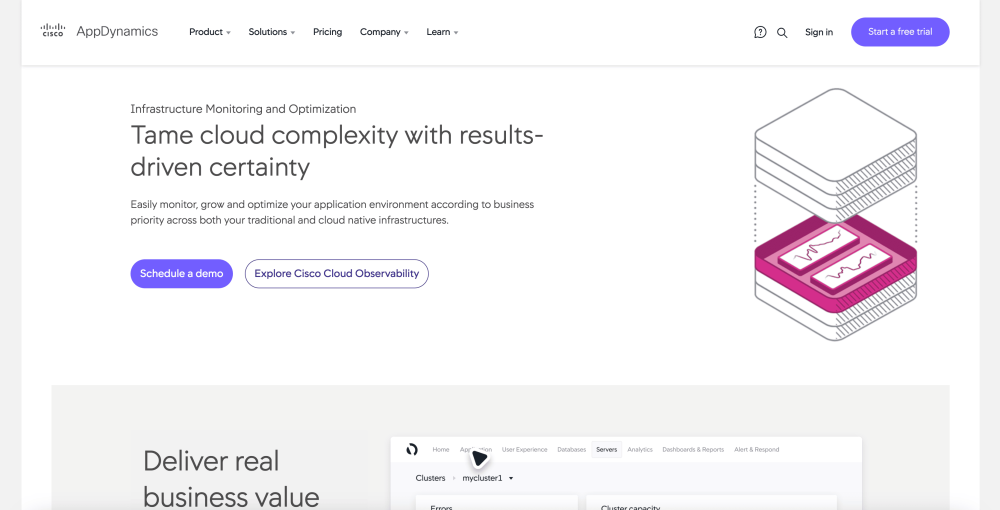
AppDynamics infrastructure monitoring solution is similar to SolarWinds in that it provides monitoring for hybird and cloud-native environments. With this solution you can also utilize automation for data collection and correlate cloud native services to application code, user experience outcomes and their impact on your business metrics.
If you found this article informative then why not read our guide to open-source SIEM or all about telemetry data next?