Resources
7 min read
Last updated:
Unlocking the full potential of observability and tracing in modern software ecosystems has become imperative for businesses striving to deliver improved reliability and user experience. In this comprehensive roundup, we will dive into the world of Jaeger-incorporated observability and tracing dashboards, offering a curated selection of the best use cases that empower DevOps teams, engineers, and developers to gain unparalleled insights into the inner workings of their applications.
These cutting-edge dashboards are designed to streamline distributed tracing, enhance performance monitoring, and simplify troubleshooting, to ultimately pave the way for improved software quality and customer satisfaction.
Contents
- 1. Monitoring Kubernetes Environments
- 2. Omnition Collector Monitoring
- 3. Distributed Tracing
- 4. Front-end Monitoring
- 5. eCommerce Monitoring
- 6. API Performance Analysis
- 7. Advanced Distributed Tracing
- 8. Traefik Tracing
- 9. Aiozipkin
- 10. SLIs and SLOs
- 11. Flask
- 12. CPU Monitoring
- 13. Application Metrics
- 14. Rust
- 15. Kobs
While many of the following dashboards use Grafana as the visualizer, Jaeger has played an important role in the functionality of these examples as we’ll detail below.
1. Monitoring Kubernetes Environments
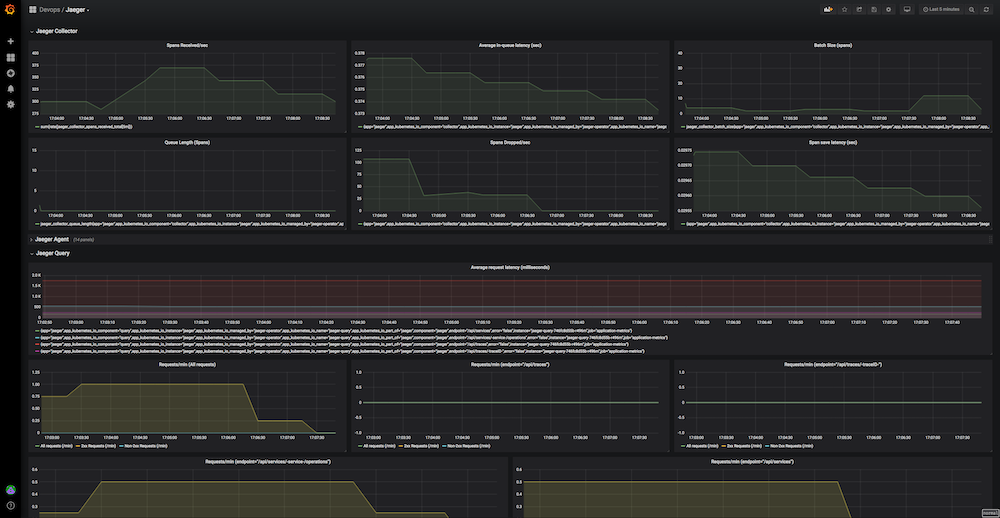
Using Grafana and Jaeger together provides a holistic perspective on your Kubernetes infrastructure within this dashboard. Grafana's dashboards enable visualization and analysis of your cluster's performance data, while Jaeger's tracing functionalities dive deep into the root causes of anomalies or performance hiccups. This approach empowers users to take proactive measures in addressing emerging problems. With the ability to visualize, analyze, and trace microservices and system performance, users can be better prepared to maintain a healthy, efficient, and highly available Kubernetes environment.
2. Omnition Collector Monitoring
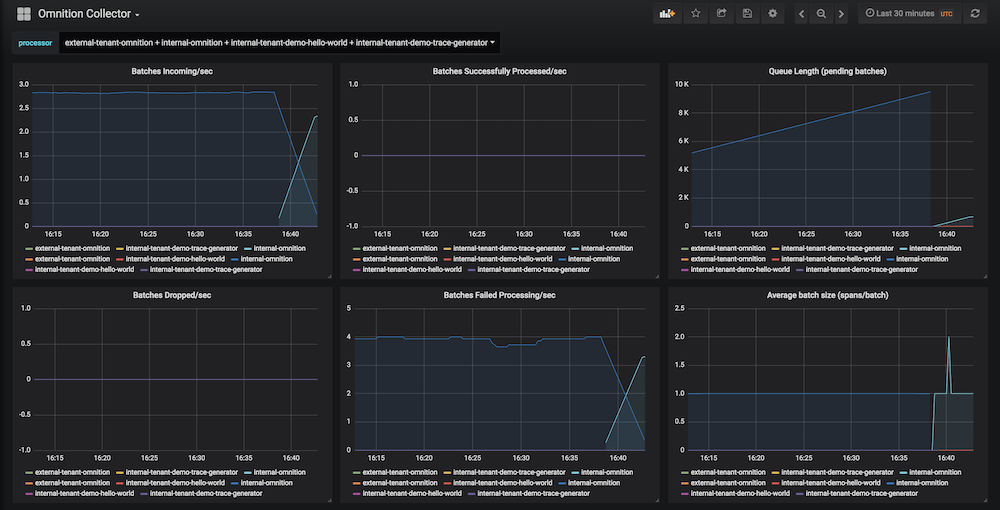
The dashboard above is vital for simplifying the initial steps in monitoring the Omnition Collector component. The Omnition Collector serves as a bridge between upstream tracing components like Jaeger Agent or OpenCensus Agent and downstream tracing components such as Jaeger Collector or even another Omnition Collector. This intermediary component supports a wide range of tracing protocols, including Jaeger and Zipkin, and offers multi-destination support with in-memory buffering and retry mechanisms to ensure reliable trace data transmission. It also enables the configuration of ingestion pipelines, making it adaptable for various use-cases in distributed systems.
3. Distributed Tracing
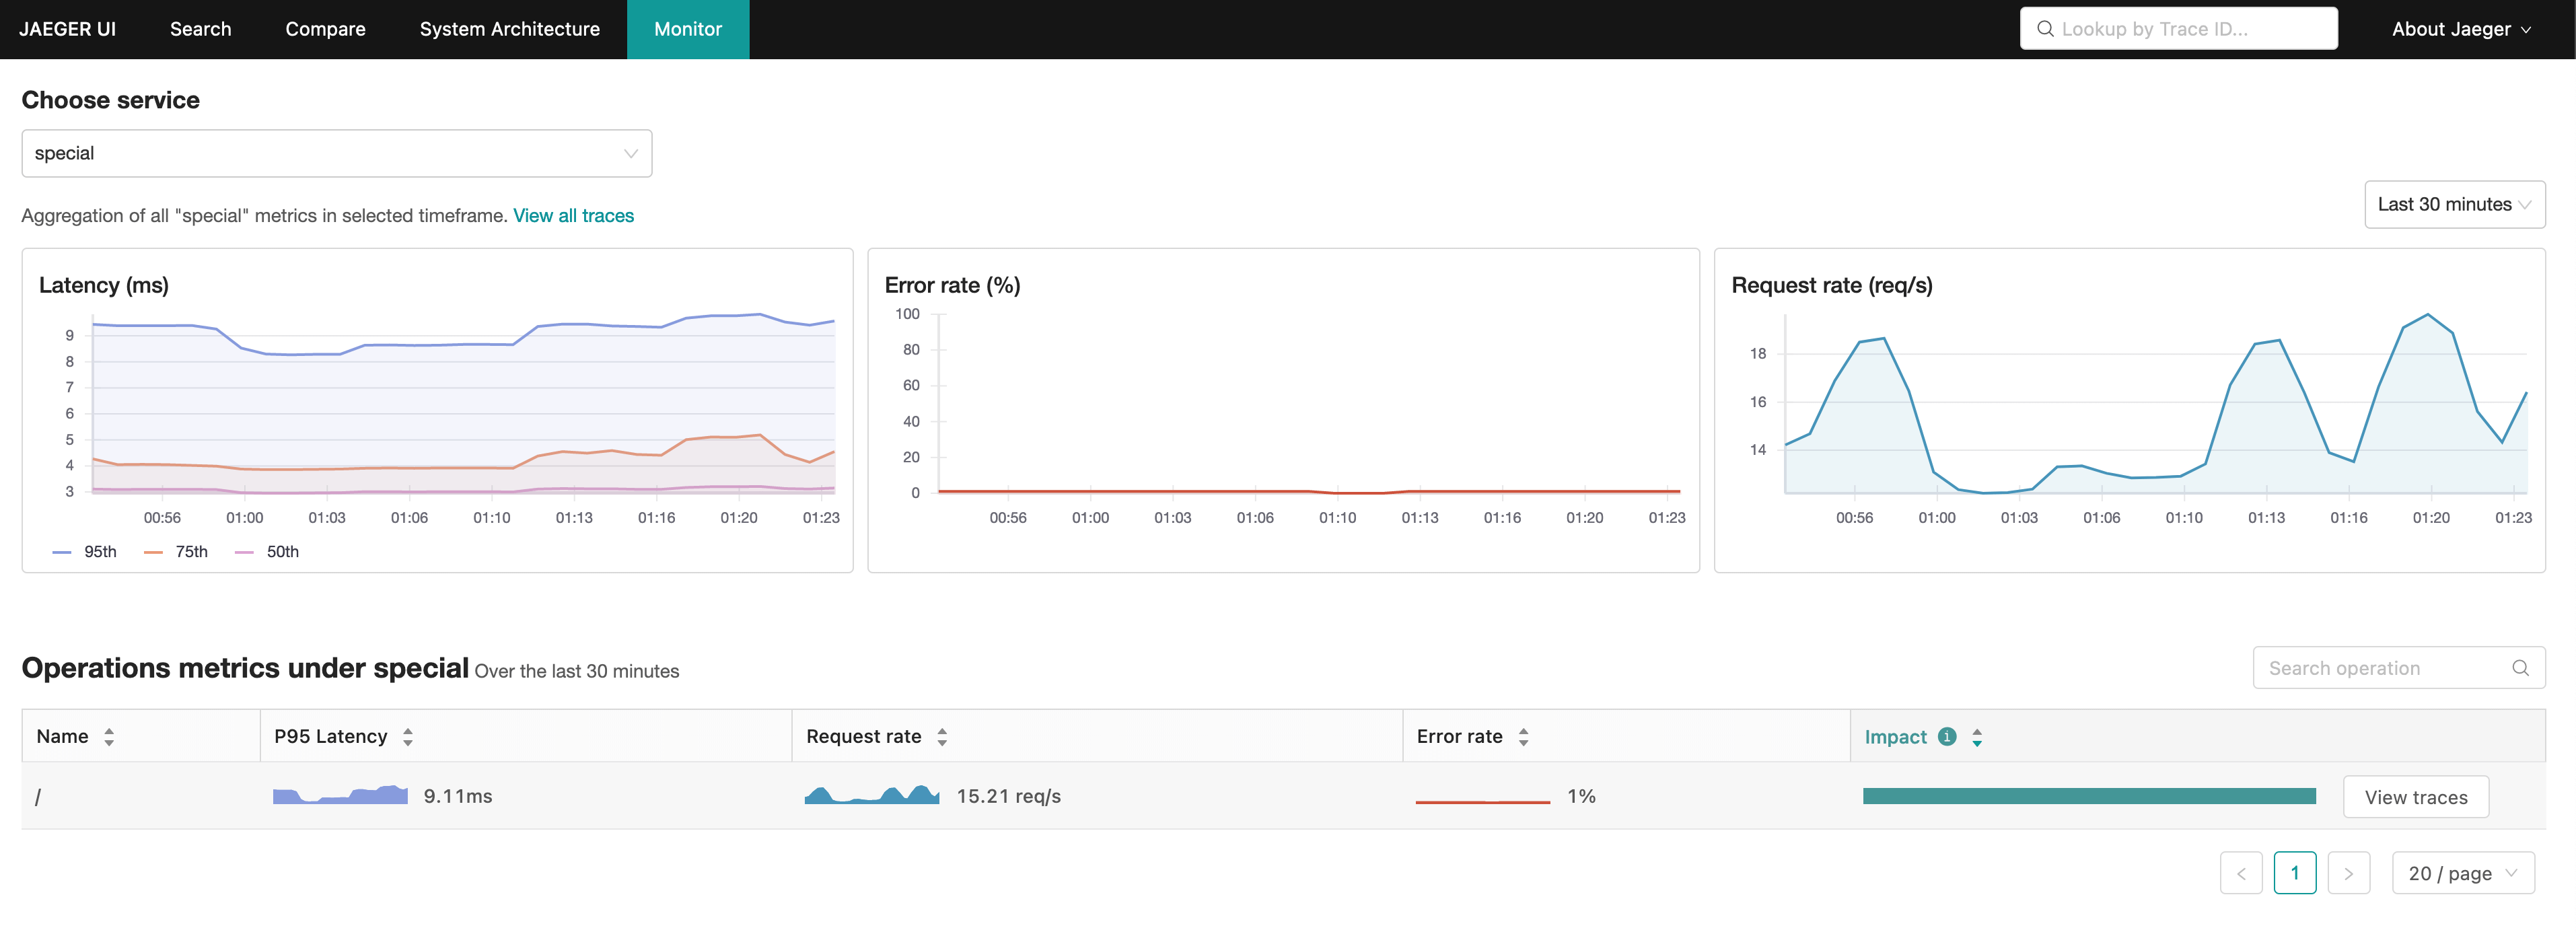
Jaeger is well known as an indispensable tool for distributed tracing (as shown in the example above), bringing unparalleled value in monitoring and enhancing system performance. With its robust capabilities, it provides a transparent and efficient way to gain insights into latency, error rates, and request rates. In the intricate landscape of distributed systems, Jaeger simplifies the identification and resolution of performance issues by tracking the journey of requests through interconnected components, thereby exposing bottlenecks and inefficiencies.
Unlock complete visibility with hosted ELK, Grafana, and Prometheus-backed Observability
Start Free Trial4. Front-end Monitoring
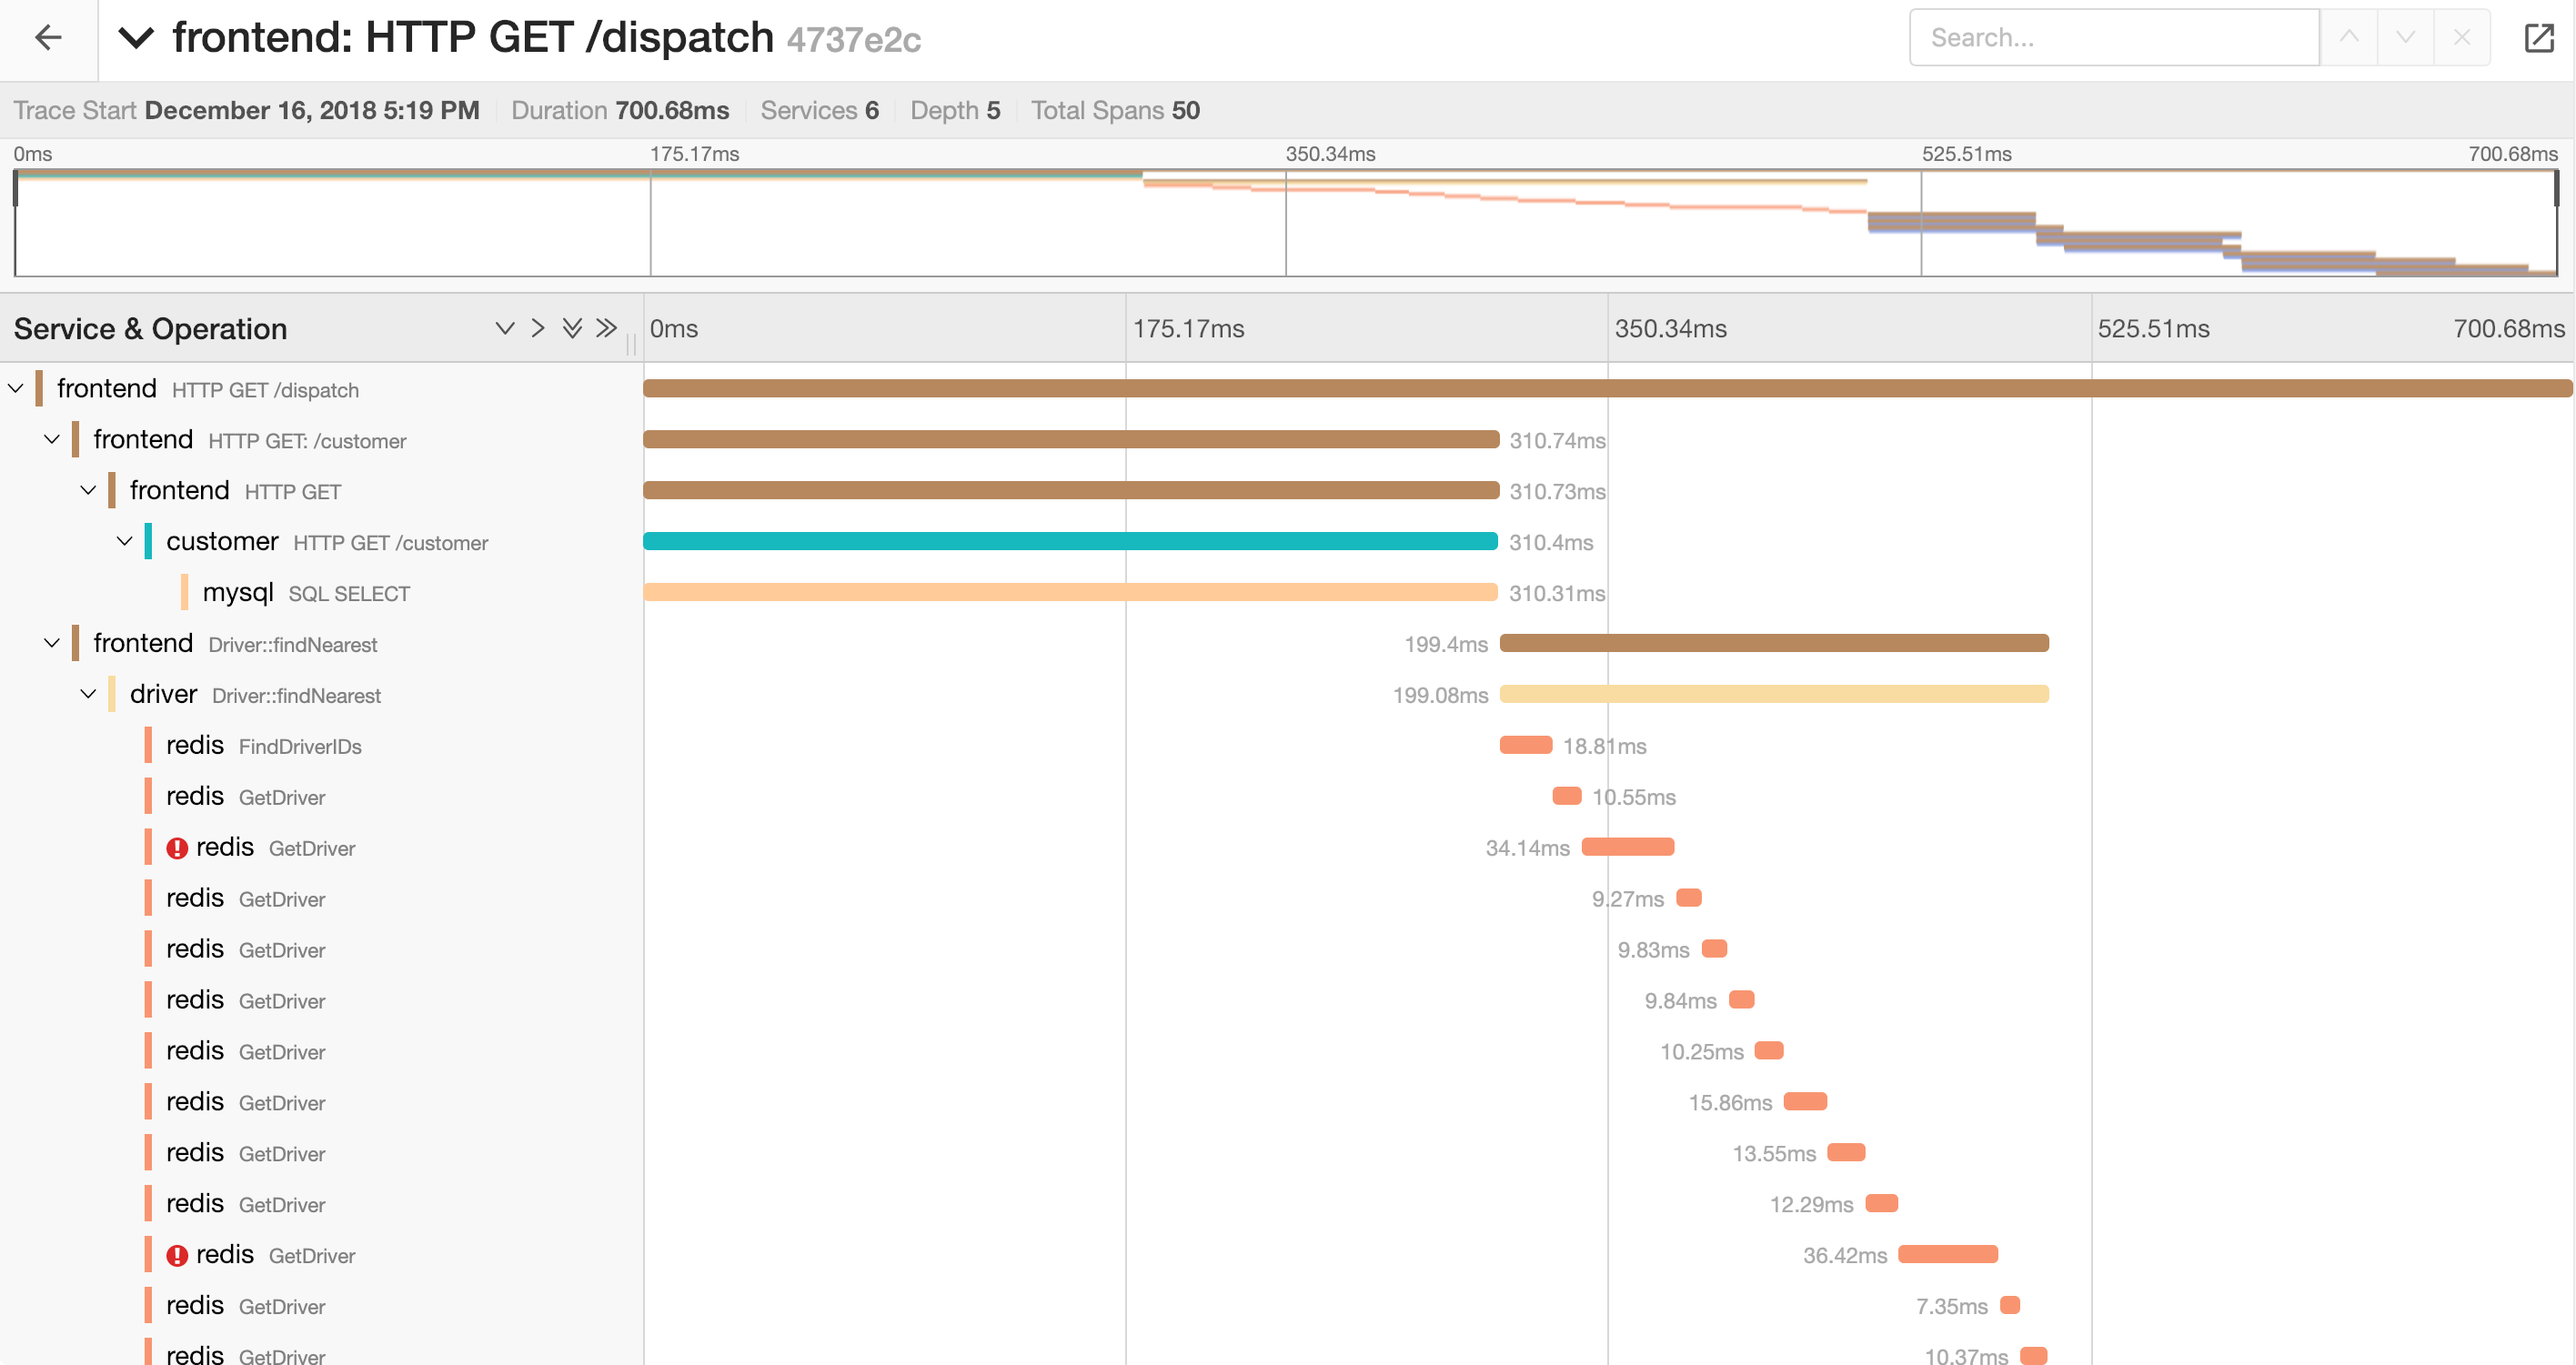
Jaeger is also an indispensable asset for front-end monitoring, offering real-time insights into application performance to enable root cause analysis, and facilitating collaboration between development and operations teams. Its scalability, open-source nature, and community support make it an essential tool for ensuring optimal user experiences, enhancing the efficiency of front-end development, and maintaining highly available application performance.
5. eCommerce Monitoring
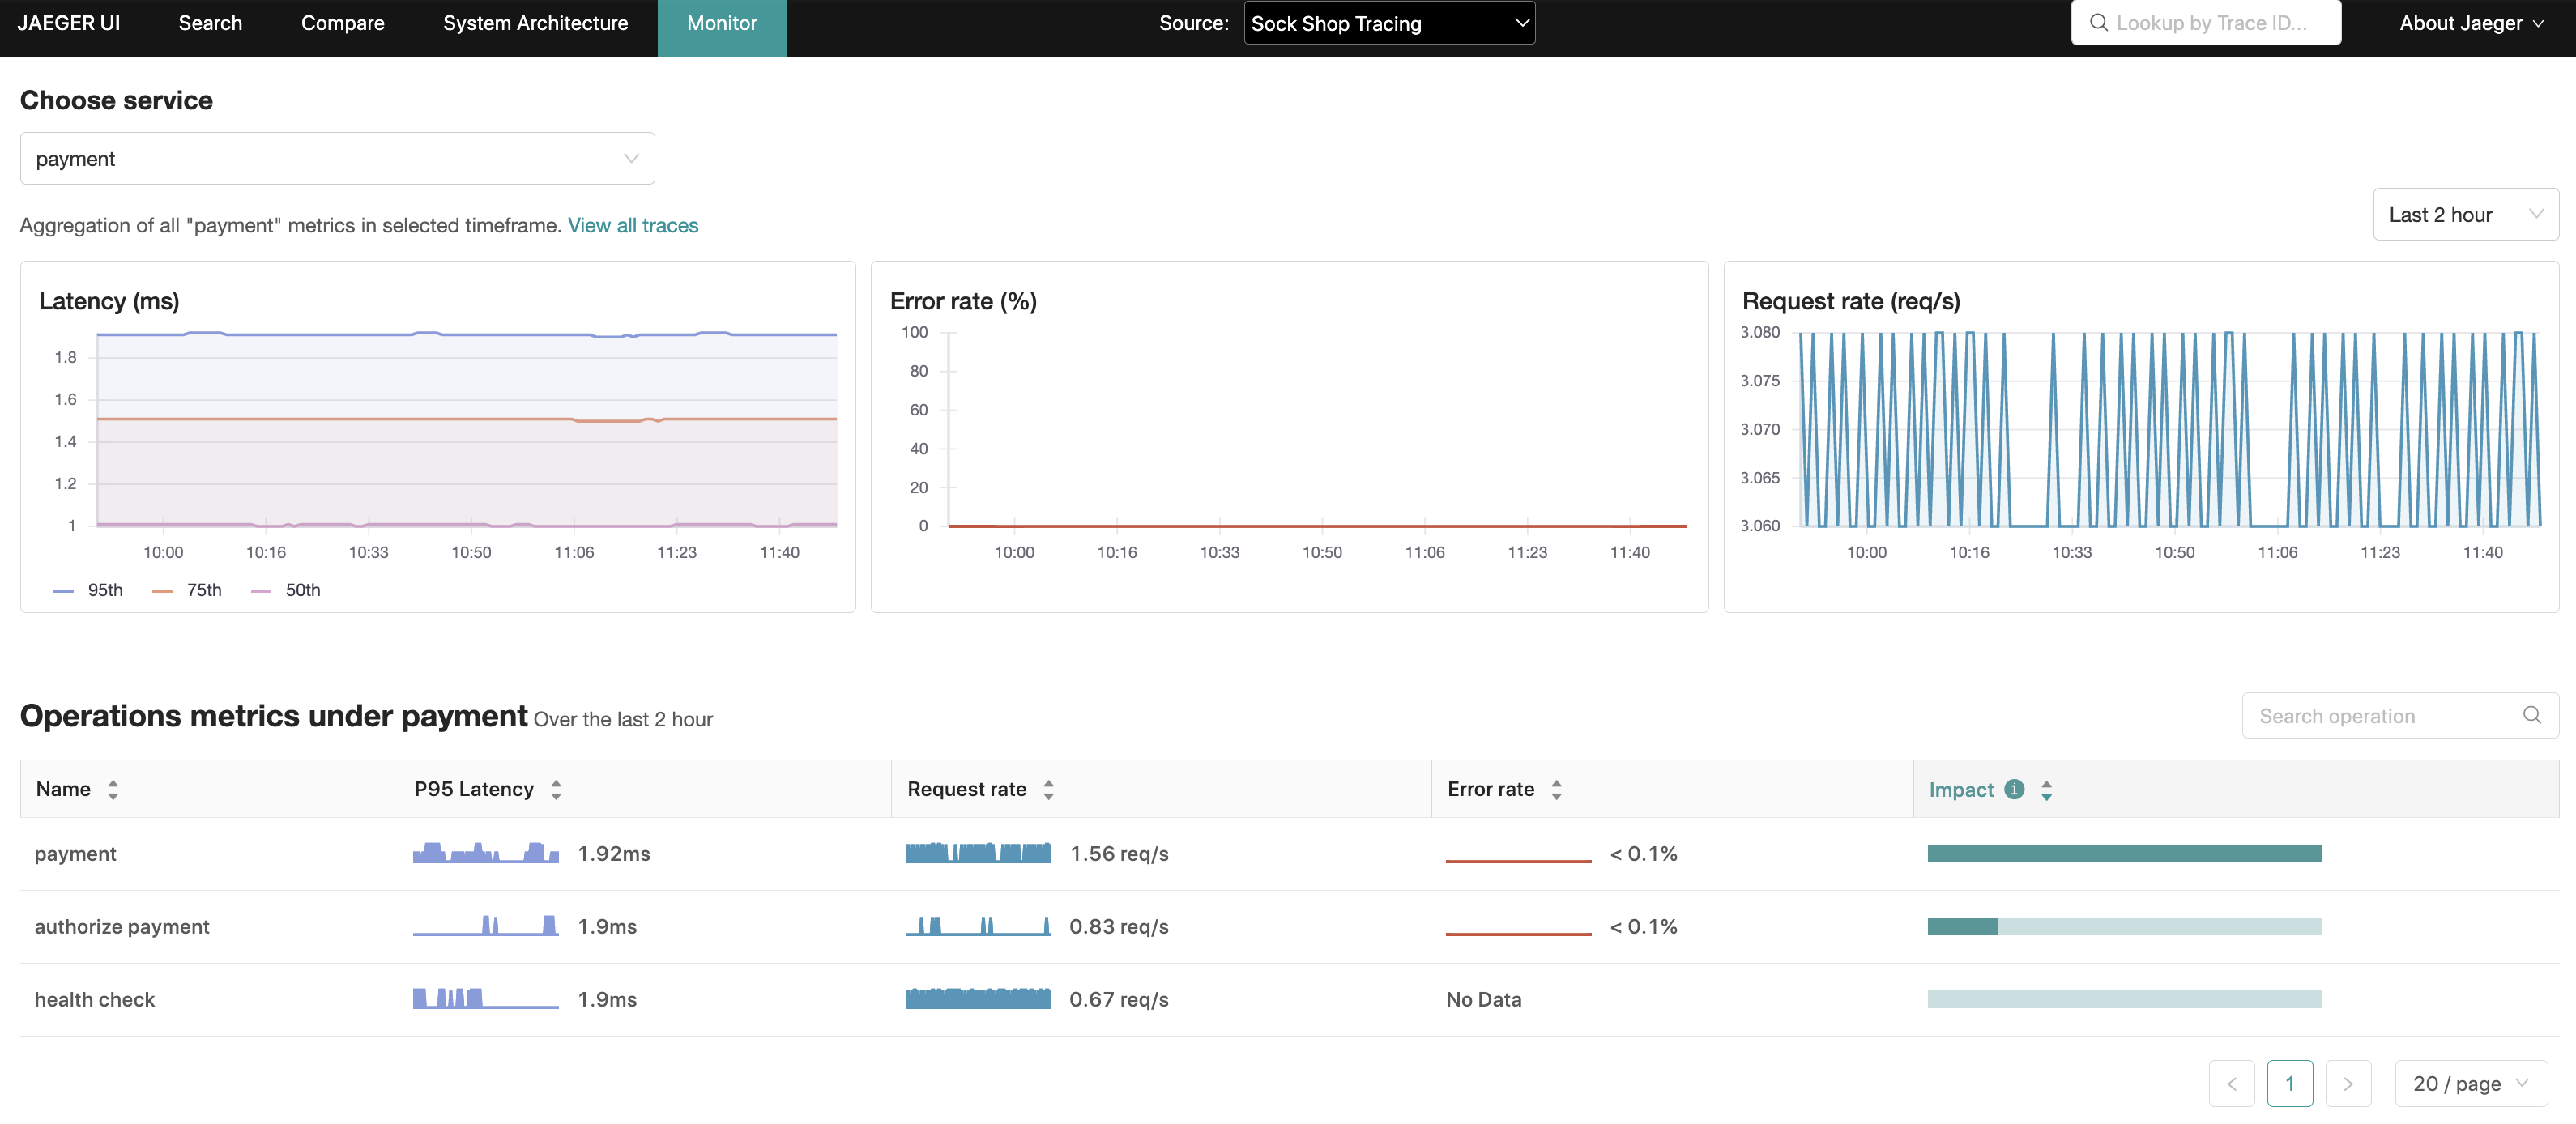
In an environment where unified customer experiences are paramount, Jaeger empowers eCommerce businesses to optimize performance, scale efficiently, and stay ahead of the curve. This open-source tracing service offers customizable reporting and dashboards, enabling you to focus on the metrics that matter most to your unique business. With Jaeger as your monitoring tool, you can ensure that more clicks lead to a conversion, keeping online stores competitive and efficient while driving success in the eCommerce landscape.
6. API Performance Analysis
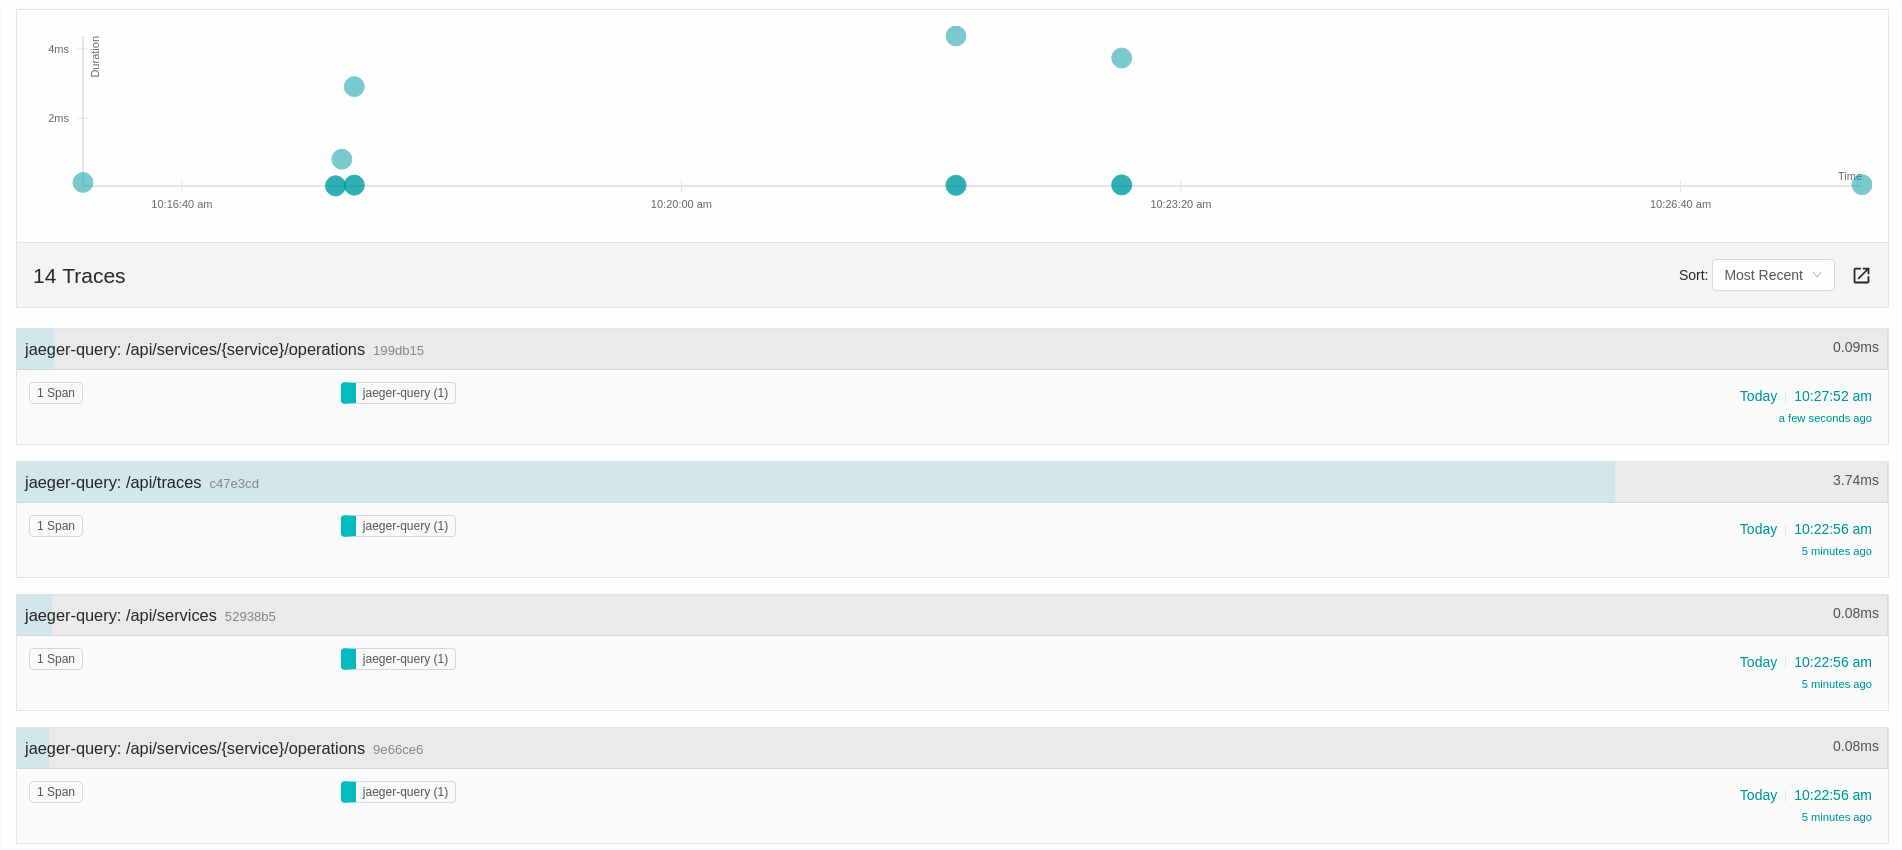
Jaeger is a crucial asset for API performance analysis due to its ability to provide real-time monitoring and in-depth insights into the application's behavior. With Jaeger, you can track the flow of requests across microservices and containers, helping you identify and address performance bottlenecks and latency issues as they happen. This real-time visibility allows for proactive problem resolution and ensures a seamless user experience.
Additionally, Jaeger simplifies the process of troubleshooting and debugging within your API environment, reducing the mean time to resolution (MTTR) by providing historical context for requests. Its scalability and adaptable nature make it an ideal choice for both monolithic and microservices-based applications. By leveraging Jaeger, you can optimize your APIs, enhance efficiency, and maintain the highest levels of performance and reliability in your application’s ecosystem.
7. Advanced Distributed Tracing
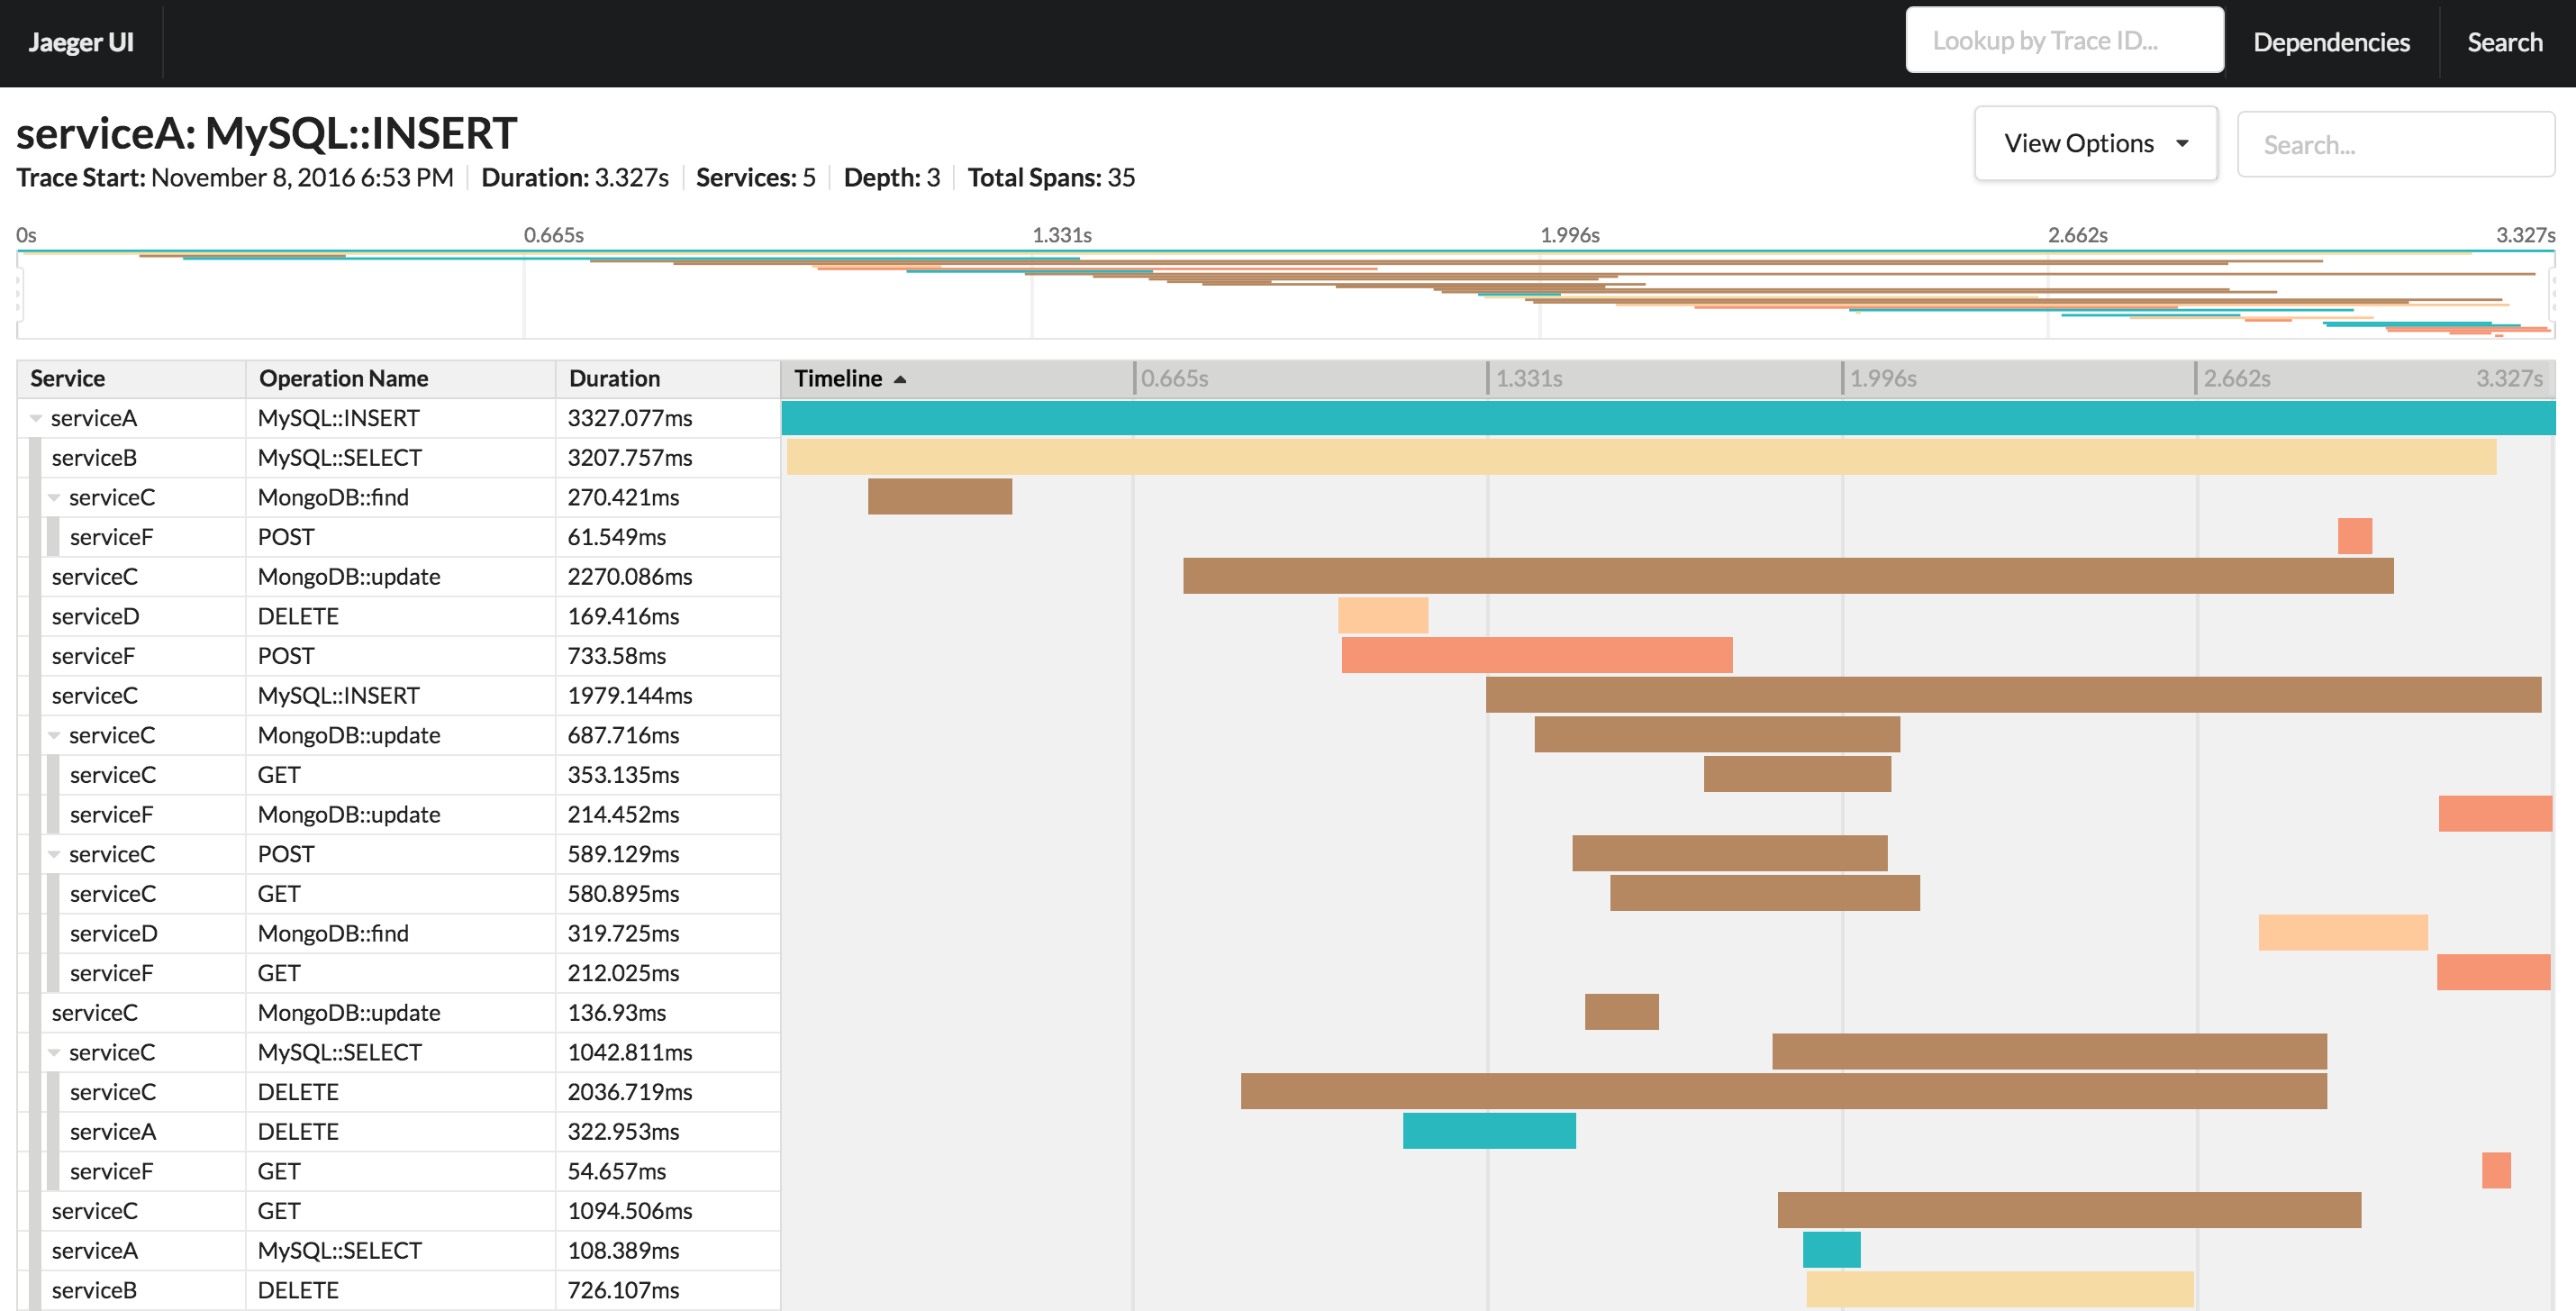
Jaeger is an indispensable tool for advanced distributed tracing, including interactions with databases like MySQL and MongoDB. This dashboard grants users an intricate, end-to-end view of data flows and service interactions, allowing for the quick identification of performance challenges.
With seamless integration across various technologies and languages, Jaeger ensures no part of your distributed ecosystem remains a mystery, simplifying root cause analysis and expediting debugging processes. By providing detailed insights into your system's performance, Jaeger empowers you to optimize services, enhance user experiences, and maximize resource utilization. Jaeger is able to scale effortlessly to accommodate growing infrastructures, ensuring continuous evolution and adaptability in an ever-changing technology landscape. Jaeger is the ultimate ally in maintaining the reliability and efficiency of your applications, offering a competitive edge in the fast-paced technical environment.
8. Traefik Tracing
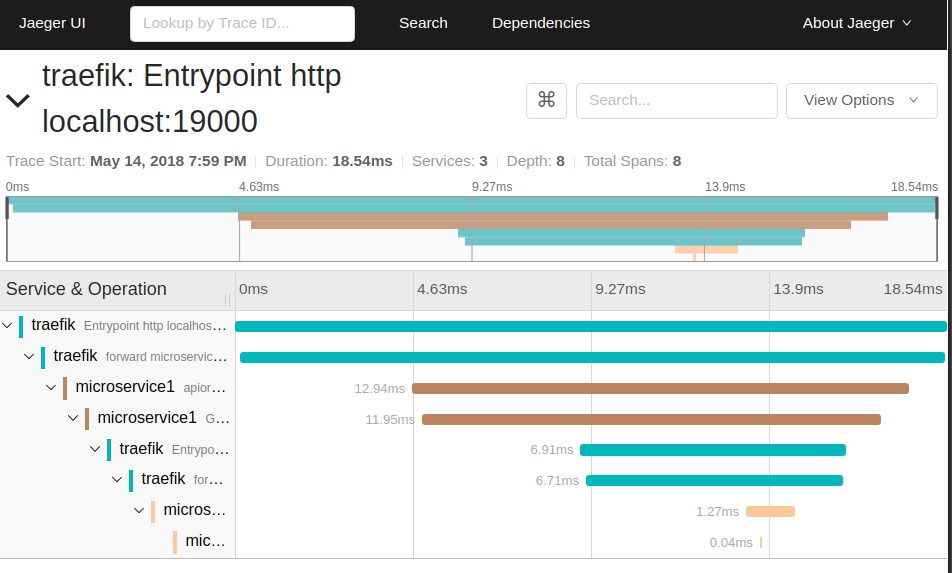
Traefik is a modern reverse proxy and load balancer and plays a pivotal role in managing complex microservices and applications. Its dynamic routing capabilities ensure seamless traffic flow, but even the most reliable systems encounter hiccups.
This is where Jaeger can come into play. Jaeger provides users with essential visibility and insights needed to keep your Traefik infrastructure running smoothly. With hosted Jaeger powered by Logit.io, you can optimize resource utilization and troubleshoot errors swiftly. By seamlessly integrating Jaeger into your Traefik setup, you gain the ability to ensure a seamless user experience, reduce operational costs, and maintain a robust and responsive microservices ecosystem.
Together within this dashboard example, Traefik and Jaeger form a powerful duo, enabling you to navigate the complexities of your web applications with precision.
9. Aiozipkin
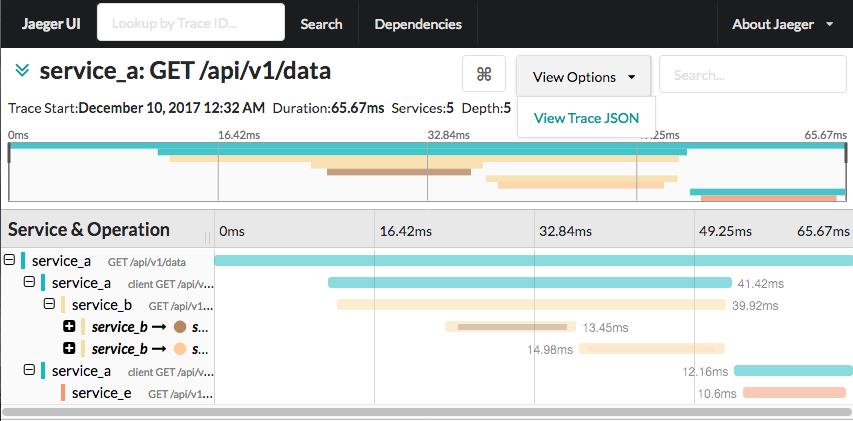
Aiozipkin is a Python 3.6+ module that inputs distributed tracing capabilities from asyncio applications with Zipkin server instrumentation. Jaeger supports the Zipkin span format making it possible to use aiozipkin with Jaeger server. With this dashboard you can view metrics relating to distributed tracing, such as traces and individual spans.
10. SLIs and SLOs
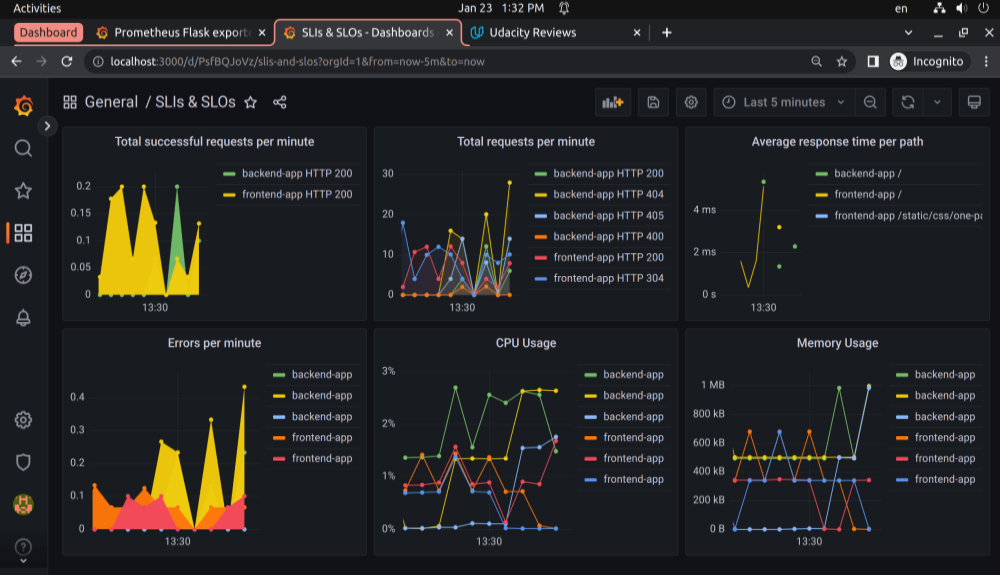
This dashboard highlights metrics relating to SLIs and SLOs utilizing Grafana to produce the dashboard and Jaeger API data. The SLIs used in this example to measure the success of the SLO are total number of minutes the application is available per month, total number of requests served per month, average response time per request, and number of outages per month.
11. Flask
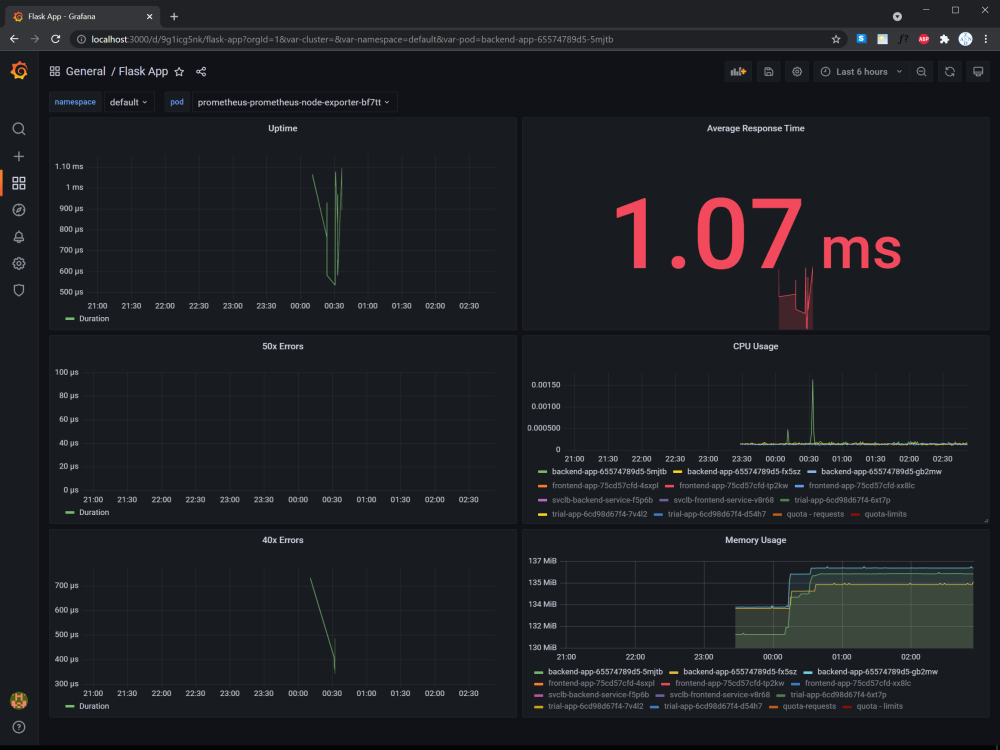
Built in Grafana, this dashboard example pulls data from Flask via Jaeger. Flask is a micro web framework written in Python. It offers helpful tools and features that make designing web applications in Python simpler. With this dashboard you can view metrics such as uptime, average response time, and memory usage.
12. CPU Monitoring
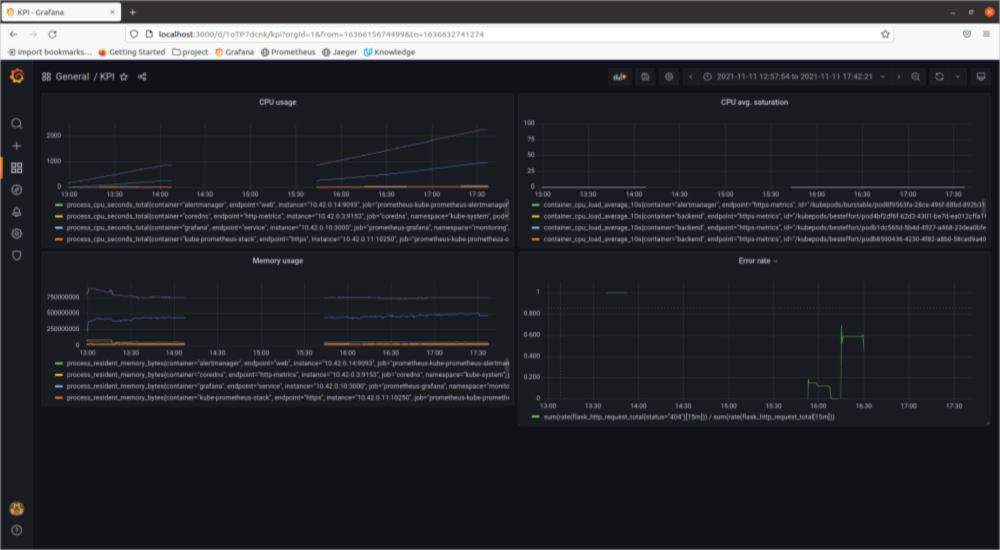
By sending your service backend data from Jaeger to Grafana you can begin visualizing your CPU usage. This is beneficial for the continuous monitoring of your CPU, helping you to act quickly if any issues arise. With this dashboard you can view a range of metrics including but not limited to CPU usage, memory usagge, and error rate.
13. Application Metrics
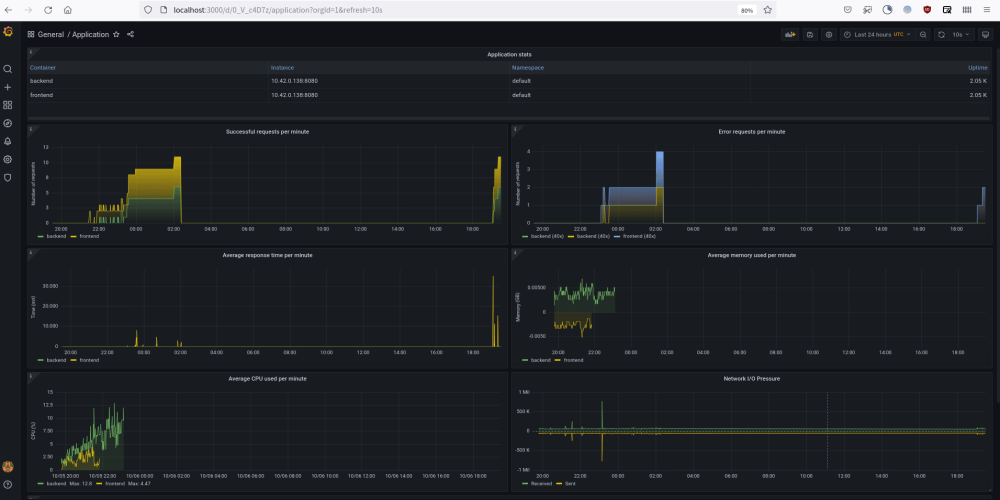
Monitoring and visualizing application metrics is a valuable practice as it allows you to gain a hollistic view of your application and facilate further analysis. By shipping data from Jaeger to Grafana you can create this application metrics dashboard example and conduct this monitoring. With this dashboard you can view metrics such as successful requests per minute, average response time per minute, and network I/O pressure.
14. Rust
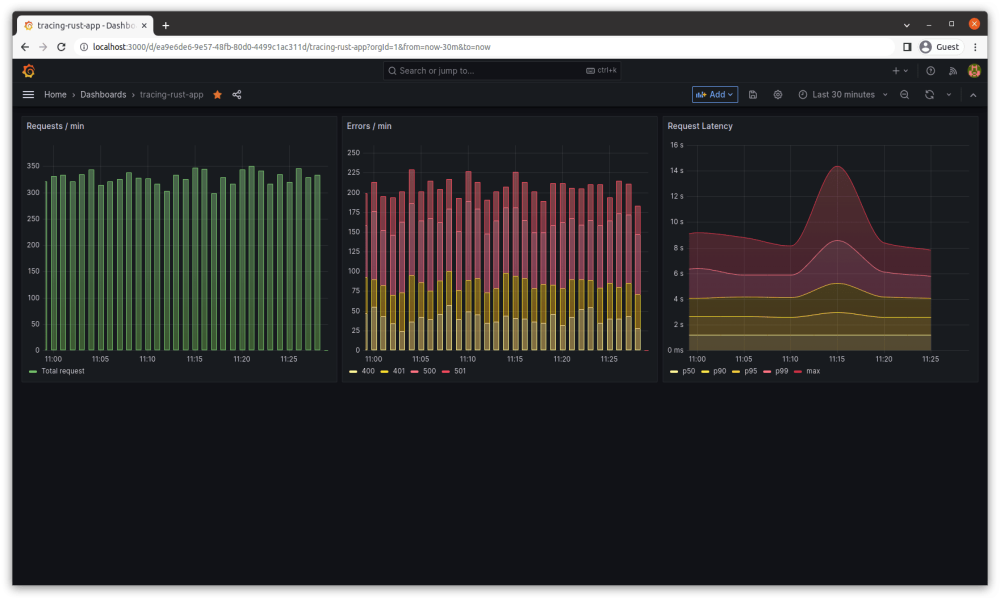
To utilize this Jaeger dashboard example you will need to build and instrument a Rust application, such as a web API with a single endpoint. Rust is general-purpose programming language that emphasizes performance, type safety, and concurrency.
Jaeger is used here to view the rust applications traces and spans, this is valuable for inspecting indiviual traces. However, to gain a deeper understanding and monitor metrics such as latency and the number of errors Grafana is used to visualize the data. This dashboard serves as a powerful tool for visualizing and understanding the performance of your Rust application. With this dashboard you can view metrics such as requests per minute, errors per minute, and request latency.
15. Kobs
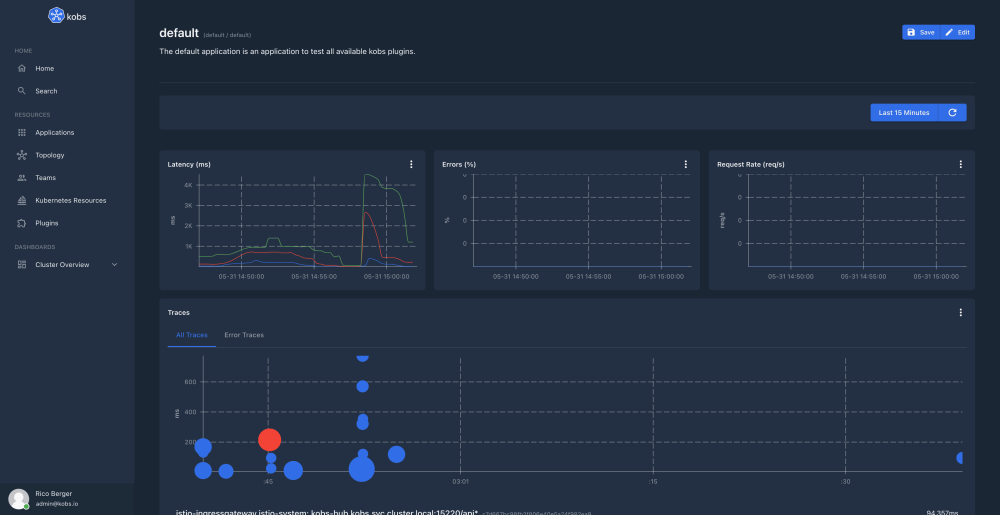
Utilizing the Kobs Jaeger plugin you can retrieve traces from a configured Jaeger instance. Kobs is an application-centric observability platform for Kubernetes and Cloud workloads, based on Custom Resource Definitions. With this dashboard you can Ypecify the service, operation and tags for which you want to retrieve traces, as well as view the details of a trace and compare it with another trace. This dashboard, built in Kobs, presents numerous metrics such as latency, errors (as a percentage), and traces.
Disclaimer: The Grafana Labs Marks are trademarks of Grafana Labs. We are not affiliated with, endorsed or sponsored by Grafana Labs or its affiliates.
If you found this article helpful then why not read OpenTelemetry Collector or tracing tools next?
