
Resources
4 min read
Java is a flexible and commonly used programming language known for its platform independence, object-oriented design, and robustness. It was originally developed by Sun Microsystems (now owned by Oracle Corporation) in the mid-1990s and soon gained popularity due to its "Write Once, Run Anywhere" (WORA) principle, allowing developers to write code that can operate on any device or platform with a Java Virtual Machine (JVM).
The popularity of Java has led to the majority of applications being Java-based and these applications need to be effectively monitored. However, monitoring the performance of a Java-based application is not a simple process. However, due to the extensive variety of Java performance tools available, offering different advantages and capabilities, it can be both challenging and time-consuming to implement the most appropriate solution for your organization. So, within this article, we will define what Java performance monitoring entails and outline the leading Java performance monitoring tools to assist you in making the correct decision for your team and organization.
Contents
What is Java Performance Monitoring?
Java performance monitoring entails monitoring and examining the behavior and efficiency of Java applications to highlight bottlenecks, enhance resource utilization, and guarantee smooth operation. This practice commonly requires the collection, measurement, and analysis of numerous performance metrics within Java applications and the underlying JVM (Java Virtual Machine). Some common JVM metrics are heap memory usage, non-heap memory usage, garbage collection statistics (e.g., frequency, duration), and thread count. As well as JVM metrics, tracking application-level metrics specific to the Java application is vital, some of these metrics include HTTP requests, response times, and transaction throughput.
Muscula

The first tool included in our list of Java performance monitoring tools is Muscula, an error-logging solution. With Muscula you can easily collect, monitor, and examine errors on your Java-based application. The tool uses AI explanations to provide more context for errors and it doesn’t need any changes to your code or a proxy, so your applications are safe. Also, Musclua provides a rapid and responsive interface, showing your errors in fewer than 100ms.
JProfiler
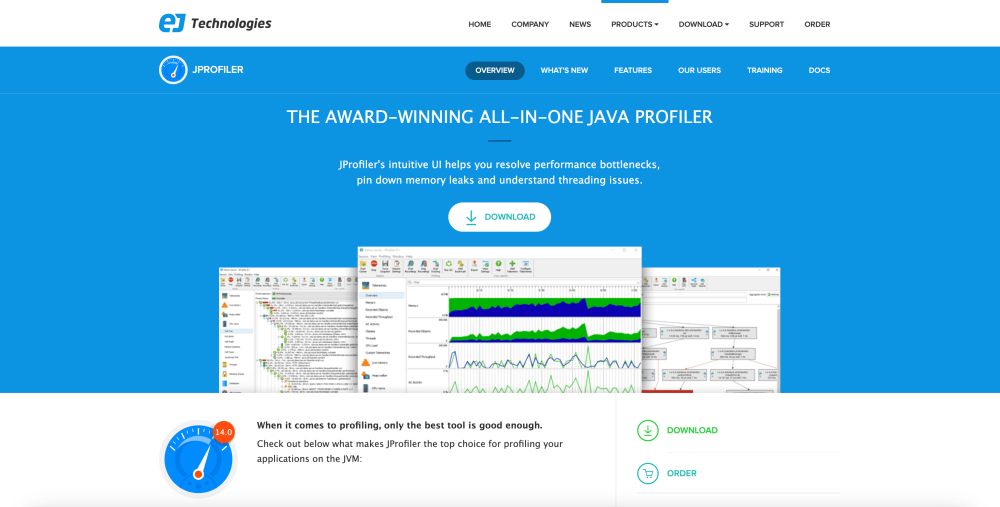
The next Java performance monitoring tool included in this article is JProfiler, developed by EJ Technologies. The solution prides itself as an award-winning all-in-one Java profiler. With JProfiler you can profile JVMs that operate in Docker or Kubernetes containers without any configuration in the container. As well as this, the tool offers analysis of memory leaks, its heap walker provides you with an intuitive interface to fix both simple and complex memory problems.
Logit.io
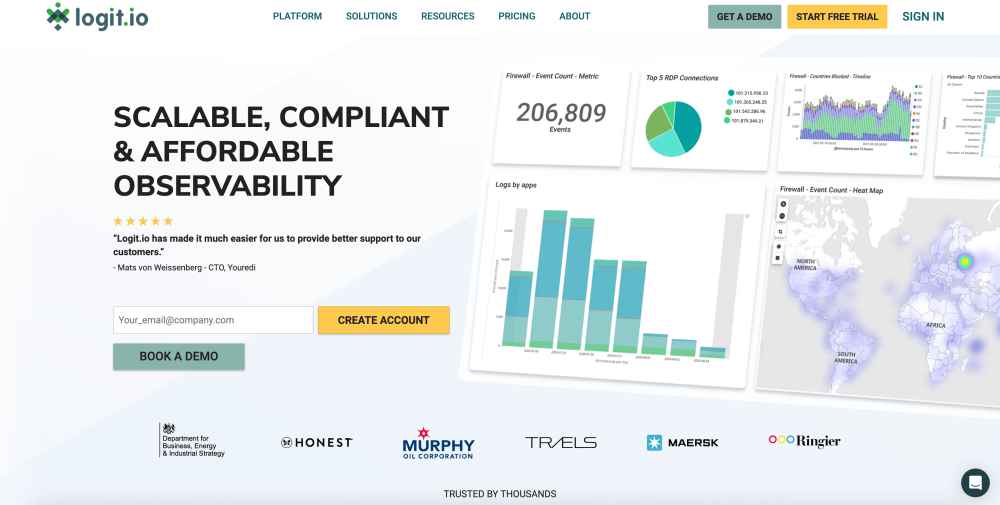
Logit.io’s native integration with OpenTelemetry makes this solution the perfect choice for Java performance monitoring. Conducting Java performance monitoring with Logit.io is painless. Simply ship traces from Java to your Logit.io stack using OpenTelemetry. This will enable you to monitor critical metrics to ensure your Java-based application is at optimal performance.
SolarWinds
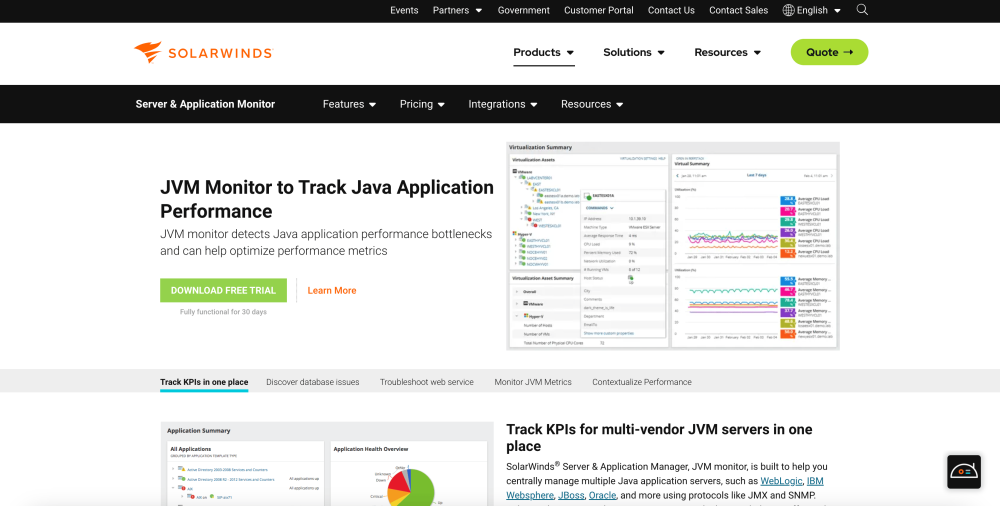
SolarWinds offers a JVM monitor solution to monitor your Java application's performance. With this tool, you can track key performance indicators such as memory heap size and thread count. Also, it assists you in monitoring server hardware performance and operating system health to help guarantee better overall application performance. As well as this, the solution automatically discovers applications and monitor servers.
JDK Mission Control
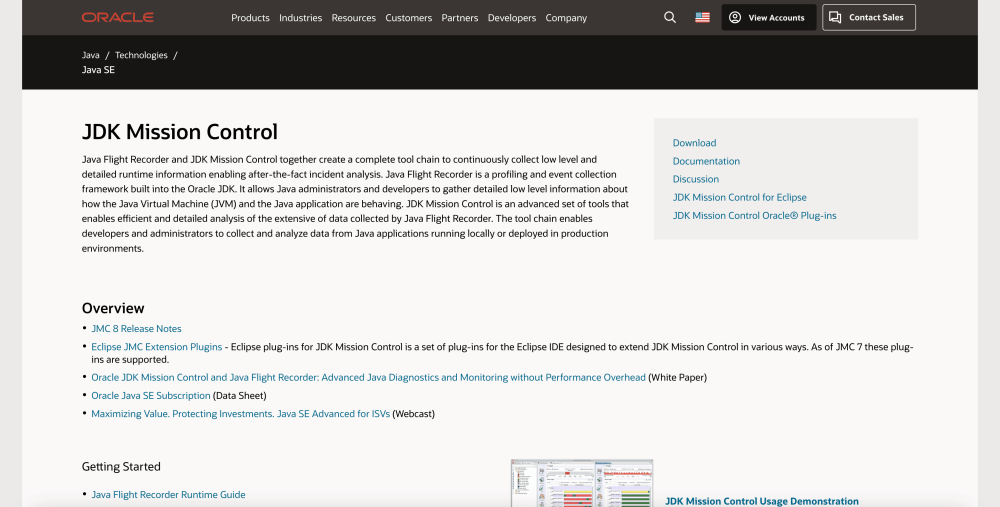
JDK Mission Control is an open-source set of tools specifically for Java virtual machine provided by Oracle. The tool facilitates efficient and detailed analysis of the extensive data collected by Java Flight Recorder. The suite of tools includes the JMX Console, which is a console for managing and monitoring the Oracle JDK through the JMX interface. JDK Mission Control allows developers and administrators to gather and analyze data from Java applications, whether they are running locally or deployed in production environments.
Stagemonitor
Stagemonitor is another example of an open-source Java performance monitoring solution but in comparison to JDK Mission Control, the majority of metrics Stagemonitor collects are not available via JMX. The tool provides you with the ability to design your plugins, utilize third-party plugins, monitor your metrics, and create or customize dashboards. As well as this, it uses the Open Tracing API to correlate requests in a distributed system.
Dynatrace
Continuing with our list of the leading Java performance monitoring tools, the next tool is Dynatrace. Dynatrace’s Java monitoring solution enables you to track and enhance Java application performance for your entire application stack, including databases and services. It enables you to deep-dive into all services and components called upon a single user interaction and examine response times to identify hotspots at the method level.
XRebel
XRebel claims to ‘set the standard’ for Java Performance Analysis and goes beyond the features of traditional profiling tools. A standout feature of XRebel is that it takes a request-based approach to performance which makes performance issues clearer and more actionable and enables developers to trace the impact of their code from beginning to end, even in distributed applications. As well as this, XRebel integrates with the majority of popular Java application development technology stacks.
Intel Granulate
Intel Granulate is an open-source continuous profiling tool that enables you to highlight code bottlenecks across any environment, at any scale making it particularly useful as a Java performance monitoring tool. The tool with constantly monitor and highlight optimization opportunities to ensure your application is running optimally. As well as this, the tool offers complete visibility without compromising SLA performance.
Sentry
The final Java performance monitoring tool included in our list is Sentry. With Sentry’s solution, you can view the entire end-to-end distributed trace to promptly highlight Java performance issues before they become downtime. Also, with Sentry’s exception handling in Java, you can triage quickly based on specific parameters like HTTP request, workflow stage, and hostname for each issue.
If you've enjoyed this article why not read The Best Ways To Learn Java or The Best Java IDEs next?