
Resources
5 min read
Now, many teams are incorporating microservices architecture, with this trend only continuing. This allows them to employ their applications across distributed environments. Whilst this is advantageous as it makes it much simpler to build, scale, and deliver it can also become much more challenging to monitor and troubleshoot the components that make up the environment.
Additionally, understanding what happening within your system is a vital aspect that all organizations need to know. For this to be possible, observability is essential. Observability is simply the ability to determine the internal state of a system by measuring its external outputs. However, this can be particularly challenging without the appropriate processes and solutions. So, to simplify this, observability tools are used. An observability tool is a software application or platform designed to help organizations track, examine, and troubleshoot the behavior and performance of their systems and applications.
However, as there are a broad variety of observability tools available, selecting the most suitable solution for your organization can be difficult. Therefore in this article, we will outline what observability is before listing 10 of the leading observability tools to aid your decision-making process.
Contents
What is Observability?
Observability, in the context of systems engineering and software development, refers to the extent to which the internal state of a system can be inferred from its external outputs or behaviors. It involves the ability to comprehend, monitor, and debug complex systems effectively. Observability is vital for guaranteeing the reliability, performance, and security of software systems, particularly those that are distributed, scalable, and operate in dynamic environments like cloud computing.
Observability is built upon three important aspects, known as the three pillars of observability, these are logs, metrics, and traces. These three data outputs offer varying insights into the health and functions of systems in cloud and microservices environments.
Telm.ai
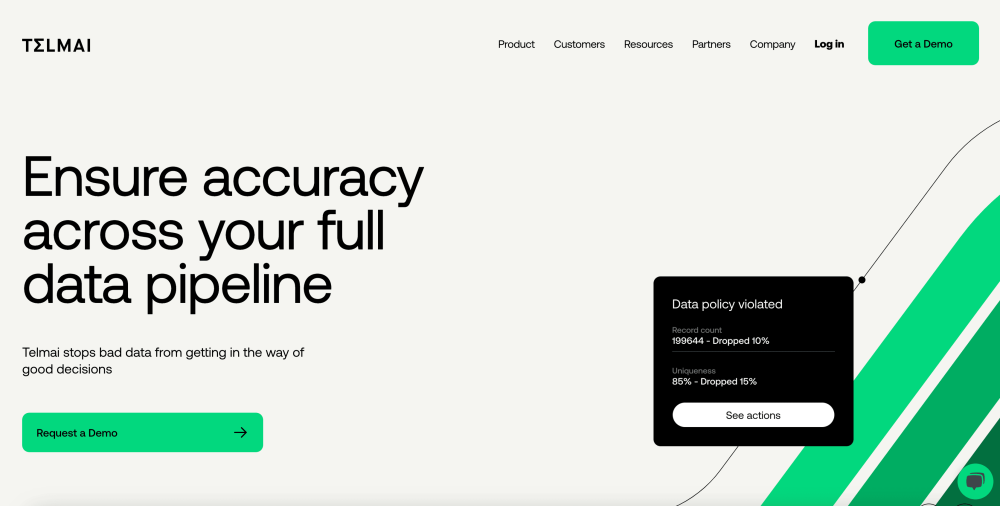
Telm.ai offers AI-based data observability for open architecture. The solution is a secure and scalable system built to guarantee data quality across your entire organization. By utilizing AI, Telm.ai describes its observability tool as intelligent because it trains itself on your data to highlight anomalies before they impact your business. As well as this, with Telm.ai there is no limit on pipeline observability.
SigNoz
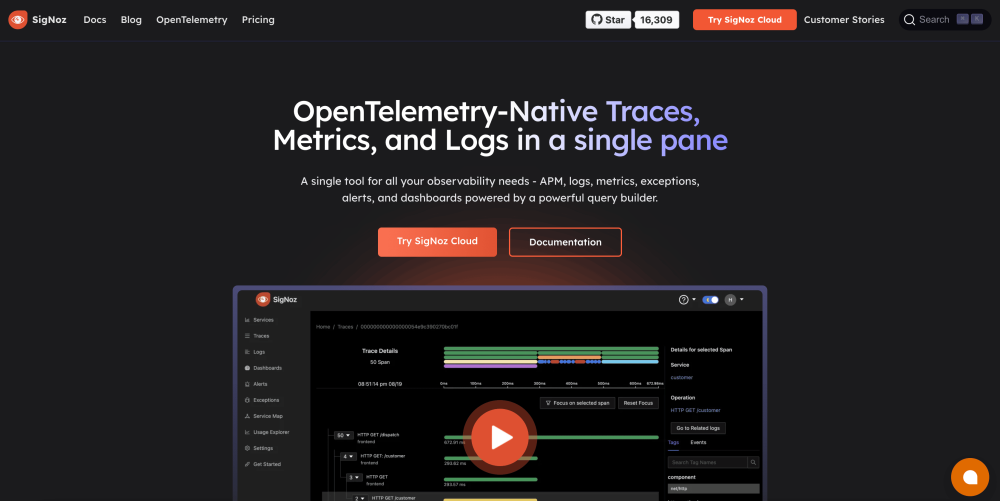
SigNoz is an example of an open-source observability tool. The platform is native to OpenTelemetry with logs, traces, and metrics in a single application. With this observability tool, you can identify the root cause of the problem by delving into the exact traces that are causing the problem and view in-depth flamegraphs of individual request traces. As well as this, it is simple to configure alerts with SigNoz’s DIY query builder.
Logit.io
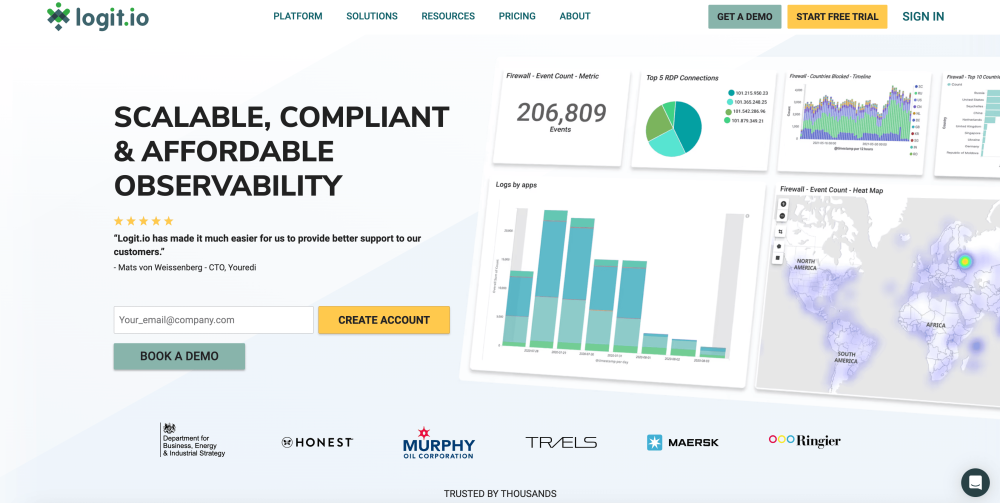
Logit.io provides an extensive cost-effective observability tool. Utilize the Logit.io platform to analyze, enhance, and oversee your applications' performance, enhancing your observability capabilities. The platform enables you to Instrument your applications with OpenTelemetry and ingest OpenTelemetry data into Logit.io, offering complete visibility on the state of all of your components and associated infrastructure.
With the Logit.io platform, you can enhance your understanding of your applications, while simultaneously accessing log management, infrastructure monitoring, compliance, and auditing dashboards from a unified, centralized platform, serving as a comprehensive observability solution. Finally, Logit.io features the best in open-source technology made scalable, compliant, and fully ready for any enterprise use case.
IBM Databand
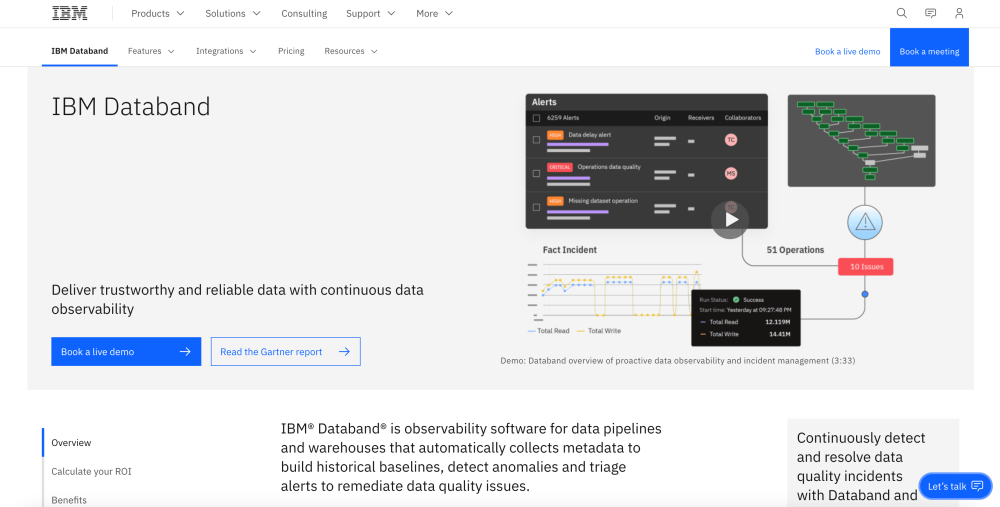
By utilizing IMB Databand you send trustworthy and reliable data with continuous data observability. IBM states that the tool is observability software for data pipelines and warehouses, which automatically gathers metadata to establish historical benchmarks, identify anomalies, and route alerts to address data quality concerns. This observability tool encompasses data incident management, data pipeline monitoring, data quality monitoring, data anomaly detection, and data lineage and impact analysis.
StackState
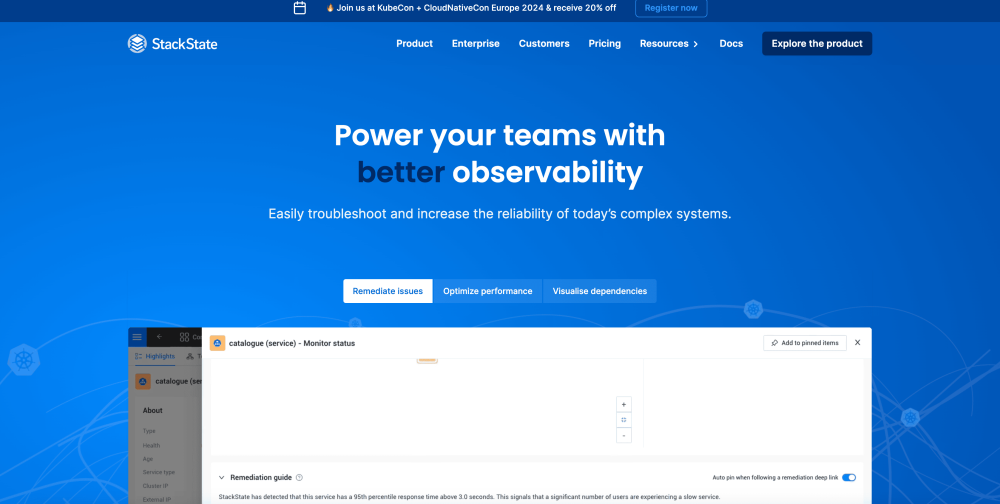
The next observability tool in our list is StackState, a Kubernetes-dedicated observability platform. With StackState you can aggregate and correlate vital metrics, logs, modifications, events, and traces centrally and present developers with comprehensive views within the context of their associated Kubernetes resources. Also, with this observability tool, you’re able to instantly apply pre-configured Kubernetes troubleshooting best practices that help you spot issues immediately.
Observe
Observe aims to meet the needs of modern applications by providing an observability cloud. With Observe’s observability cloud, you can utilize a single data source, troubleshoot both known and unknown issues, and retain over a year's worth of data. This observability tool can ingest data from numerous data sources including Docker, Kubernetes, AWS, and OpenTelemetry.
Percona
Percona is an open-source database monitoring, observability, and management tool. The observability tool provides MySQL monitoring, MongoDB monitoring, PostgreSQL, and monitoring. Also with Percona’s Query Analytics, you’re able to zoom in and delve into on database performance, from node to single-query levels. This allows for the quick locating and fixing of bottlenecks and slow-running queries.
Cribl Stream
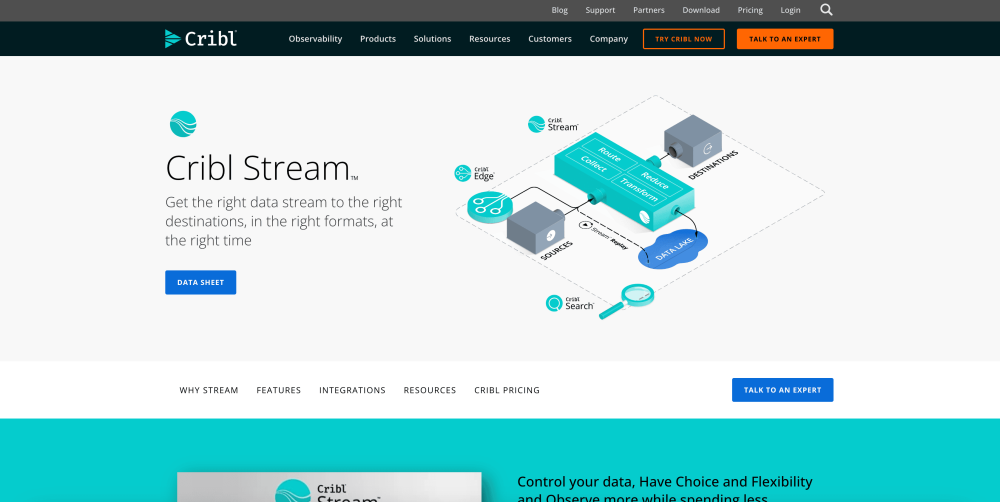
Cribl Stream offers a vendor-neutral observability pipeline, providing the flexibility to gather, condense, enhance, standardize, and direct data from any origin to any destination within your current data architecture. Additionally, with this observability tool, you can attain your legs, metrics, and traces from a variety of sources to any destination. Utilize Cribl Stream’s Quick Connect for easier and faster data onboarding.
Splunk
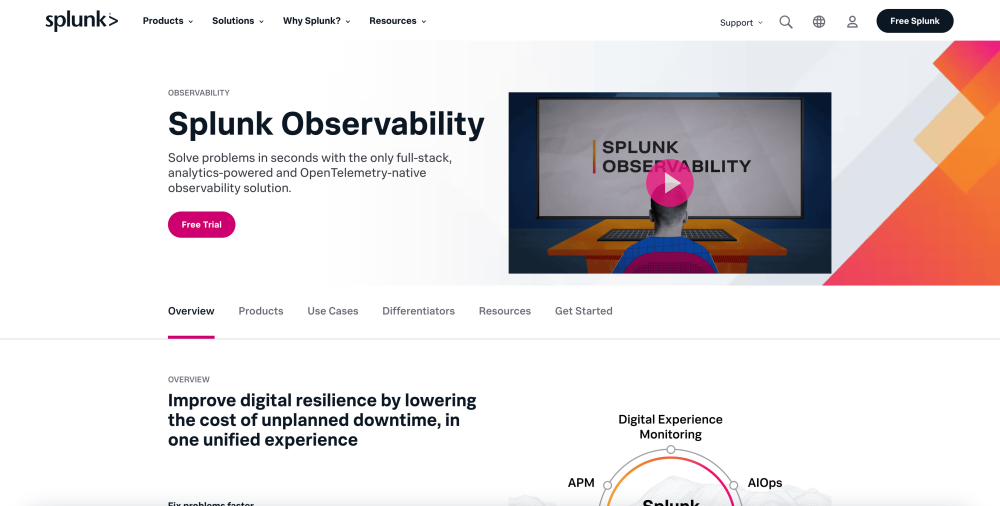
Splunk’s observability tools are focused on cloud technologies, allowing your organization to remain agile and flexible so you can drive high performance and excel in the cloud. Also, if you utilize cloud-native apps you will understand how complex they can be. Splunk aims to make it simpler to solve issues across your entire system and states that one engineer can confidently solve these problems. Finally, with Splunk’s observability tools you can receive AI-assisted, guided troubleshooting that incorporates business context and offers direction on where to focus when addressing issues.
Atlan
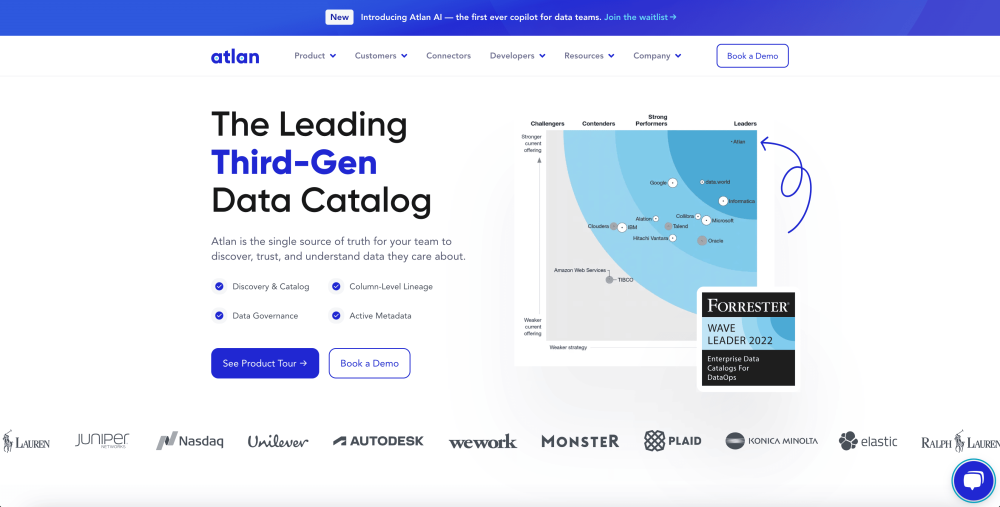
Atlan is a data catalog that aims to supply a single source of truth for your team to identify, trust, and understand your data. Atlan describes its search tool as ‘Google for your data’ allowing you to search across your data universe using natural language, business context, or using SQL syntax. Lastly, the observability tool aims to be streamlined and efficient by relying on automation for repetitive tasks.
If you've enjoyed this article why not read our Beginner's Guide to Observability or our article on Observability vs Monitoring next?