
Resources
9 min read
Observability is the ability to understand the internal workings of a system by measuring and tracking its external outputs. In technical terms, it entails collecting and examining data from numerous sources within a system to attain insights into its behavior, performance, and health. All organizations are now familiar with how essential observability is to ensure optimal performance and availability of their IT infrastructure. To conduct effective observability, powerful querying and analytics tools are crucial. OpenSearch is a popular and open-source distributed search and analytics engine that can facilitate observability.
OpenSearch plays a vital role in improving observability by offering robust monitoring, logging, and tracing capabilities tailored to modern distributed systems. Through its monitoring features, OpenSearch allows users to track key metrics such as cluster health, resource utilization, query latency, and indexing rates in real time. As well as, OpenSearch's logging functionality enables the collection, storage, and analysis of log data from multiple sources within the system, facilitating the detection of anomalies, troubleshooting of issues, and compliance with auditing requirements. Lastly, OpenSearch supports distributed tracing, allowing users to trace individual requests as they move through the system, pinpointing performance bottlenecks, and enhancing system efficiency.
In this guide, we will outline what OpenSearch observability is, the advantages of using OpenSearch for observability, and the best practices associated with using OpenSearch for observability.
Contents
What is OpenSearch Observability?
OpenSearch observability refers to the extensive visibility and insight into the performance, health, and behavior of OpenSearch clusters and associated applications and infrastructure. It encompasses monitoring, logging, and tracing capabilities that allow users to understand, troubleshoot, and enhance the entire system's operation. With OpenSearch observability, users can monitor critical metrics such as cluster health, resource utilization, query latency, and error rates, as well as gather and examine log data to highlight issues, anomalies, and trends. Additionally, tracing capabilities enable users to trace requests through the system and detect performance bottlenecks or inefficiencies.
Why You Should Use OpenSearch For Observability
OpenSearch has numerous powerful and useful features and capabilities that make the tool a perfect choice for observability. An example of this is that the solution offers comprehensive monitoring capabilities. With OpenSearch, you can track key metrics such as cluster health, resource utilization, query latency, and indexing rates in real time. This real-time monitoring capability allows you to attain immediate insights into the performance and health of their systems, facilitating proactive troubleshooting and optimization.
In addition to this, OpenSearch's logging features are highly flexible and powerful, proving it as a valuable tool for observability. With OpenSearch, users can collect, store, and examine log data from multiple sources within their systems, including applications, servers, and network devices. This capability allows you to attain deep insights into system behavior, detect anomalies, and troubleshoot issues effectively. Additionally, OpenSearch's distributed tracing support enables you to trace individual requests as they travel via their systems. This feature is invaluable for detecting performance bottlenecks, understanding system dependencies, and enhancing system efficiency.
When selecting a tool for observability, high scalability, and flexibility are crucial factors and OpenSearch provides this. OpenSearch is designed to scale horizontally and manage large volumes of data with ease. This scalability guarantees that you can track and examine data effectively, even in high-volume environments. Additionally, OpenSearch is known for its reliability, making sure that observability data is always available when needed. Whether you are monitoring a small deployment or a large-scale production environment, OpenSearch can scale to meet your requirements while maintaining high availability and reliability.
Lastly, with OpenSearch, you are not restricted by integrations with other tools and services. OpenSearch integrates seamlessly with popular logging frameworks, visualization tools, and alerting services, enabling you to construct an extensive observability stack tailored to your specific requirements. This integration flexibility guarantees that you can utilize your existing tools and workflows while benefitting from OpenSearch's powerful observability capabilities.
How To Configure OpenSearch for Observability
To ensure you can effectively monitor and examine your systems and applications, we’ve listed a few steps that you should follow to configure OpenSearch for observability.
Installation and Configuration: Begin by downloading and installing OpenSearch. You can find the installation instructions on the official OpenSearch website. Once installed, configure OpenSearch to operate on your system. This typically involves setting up configurations like cluster names, node configurations, network configurations, etc.
Configure Observability Data Collection: OpenSearch offers numerous plugins and tools for observability, including OpenSearch Dashboards (formerly Kibana), OpenSearch Alerting, OpenSearch Trace Analytics, etc. Depending on your needs, install the relevant plugins. Configure data collection for metrics, logs, and traces from your systems and applications. You can use tools like Metricbeat for collecting metrics, Filebeat for logs, and OpenTelemetry or Jaeger for distributed tracing.
Index Management: Outline index patterns for your data in OpenSearch. Index patterns assist in organizing and managing your data efficiently. You can outline index templates with mappings and settings to guarantee your data is indexed correctly.
Create a Dashboard
These steps outlined below, will take you through the process of creating your first dashboard in OpenSearch.
Navigate to the Visualize Tab: Once you're logged in to OpenSearch, navigate to the "Visualize" tab in the left sidebar menu. This is where you create visualizations that you can later add to your dashboard.
Create Visualization: Select the ‘Create visualization’ button to begin creating your first visualization. Choose the type of visualization you want to build. OpenSearch Dashboards support numerous types such as line charts, bar charts, pie charts, maps, etc. Choose the index pattern that contains the data you want to visualize. Select the "Save" button to save your visualization. Repeat this process for additional visualizations.
Create a Dashboard: Once you've created your visualizations, navigate to the ‘Dashboard’ tab in the left sidebar menu. Select the ‘Create dashboard" button to design a new dashboard. Drag and drop the visualizations you built earlier onto the dashboard canvas.
Customize the Dashboard: Customize the dashboard by adding additional elements such as text panels, markdown widgets, or controls. Add filters to the dashboard to enable users to interactively filter the data displayed in the visualizations.
Save and Share the Dashboard: Once you're satisfied with your dashboard, select the ‘Save’ button to save it. Supply a name and optional description for the dashboard.
Configure Alerting
These steps will take you through how to configure an alert for server high CPU in OpenSearch.
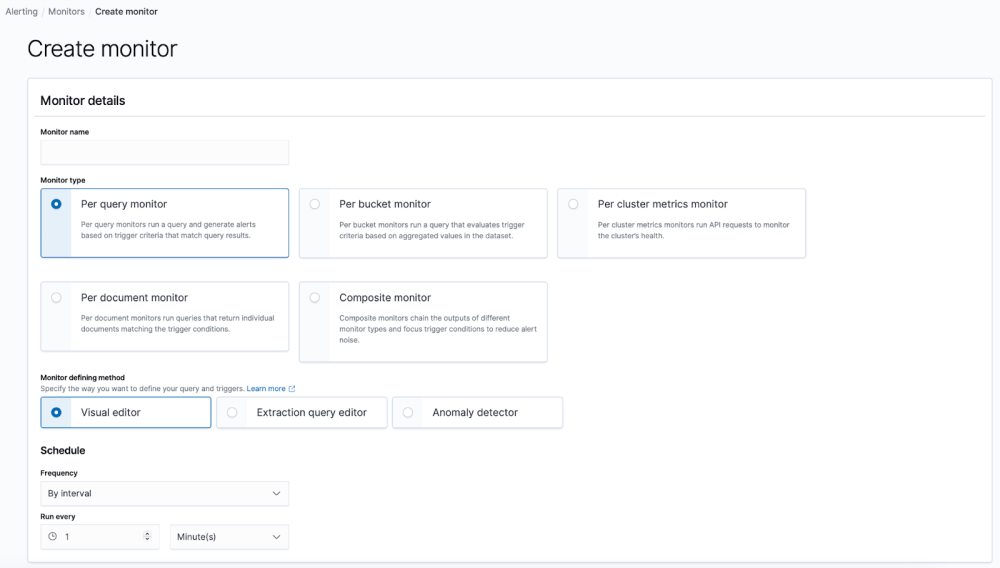
Create Monitor:
- Choose alerting from the left side menu and move to the monitors tab.
- Monitor Name: Assign your monitor a name to highlight its purpose.
- Monitor Type: Choose ‘Per Query Monitor’ to design a monitor that tracks separate search queries.
- Monitor Defining Method: Select ‘Visual Editor’ as the defining method. This offers a user-friendly interface for designing your monitor.
- Schedule Frequency: Set ‘Run Every’ to specify how frequently you want the monitor to operatee. For this example, every 5 minutes.
Define Query:
- Within the Visual Editor, you'll find the query builder interface.
- Set up your query by choosing the index, time field which is often @timestamp, and outlining search conditions.
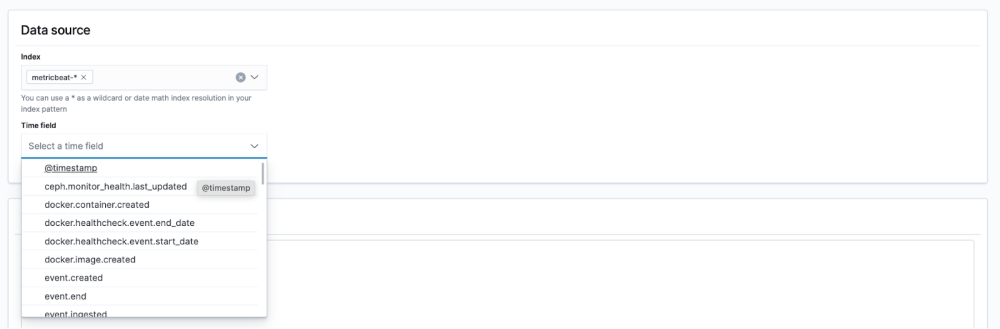
- Change the query in the query editor, choose the “Time range for the last” as 1 minute and the ‘Data filter’ to system.cpu.user.norm.pct is greater than 0.85. Select ‘Preview query and performance’ to view the amount of hits this would match in your data.
Set Trigger Conditions:
- Choose ‘Add Trigger’ to build alert conditions.
- Define the severity level for each trigger condition, such as High, Medium, or Low.
- Set up the trigger conditions depending on your query results. As an example, you can trigger an alert when the amount of results surpasses a specific threshold. For our example set ‘Trigger condition’ to 0 for testing.
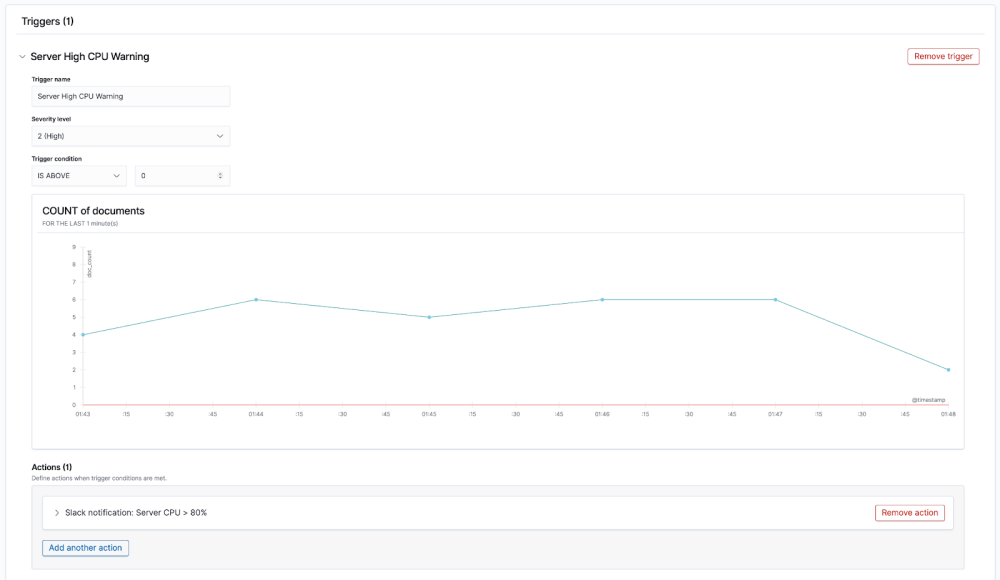
Outline Actions:
- You may decide you want to take specific actions when an alert is triggered, simply define actions to do this. An action could be sending notifications or executing custom scripts.
- Select ‘Manage Channels’ to open a new window, here you can input your slack channel information, then return to this tab and choose your slack channel from the list.
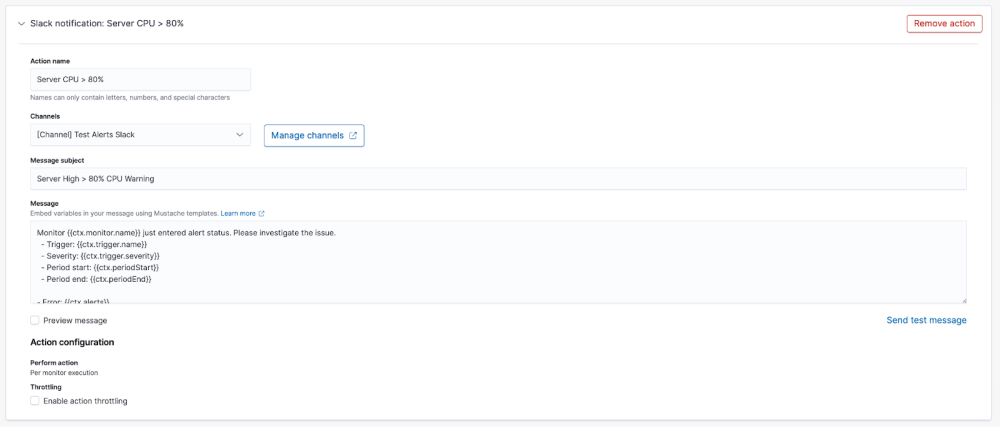
- Set the Message as the default and select ‘Send test message’ to ensure that the alert arrives in your desired Slack channel.
Save and Activate:
- If you’re content with the monitor configuration, choose ‘Create’ to save the new Monitor.
- Once you’ve saved the monitor, you can activate it to begin tracking your data based on the defined query and trigger conditions.
OpenSearch Observability: Best Practices
To assist you in conducting observability with OpenSearch and ensuring comprehensive monitoring, effective logging, and efficient tracing we have listed the best practices for you to follow.
Outline Monitoring Objectives: Outline the objectives of your monitoring strategy, such as the critical metrics and performance indicators you want to monitor. This could include cluster health, resource utilization, query latency, indexing rates, and error rates.
Utilize Centralized Monitoring: Centralize your log data by shipping logs from all relevant sources to a centralized logging platform, such as OpenSearch via Logit.io. Utilize structured logging formats and log enrichment techniques to standardize log data and optimize searchability and analysis.
Instrument Distributed Tracing: Instrument your applications and services to allow for distributed tracing, enabling you to trace individual requests as they move through your system. Use OpenSearch's distributed tracing capabilities to visualize request flows, highlight performance bottlenecks, and enhance system efficiency.
Implement Real-Time Monitoring: Configure real-time monitoring for key metrics and performance indicators using OpenSearch's monitoring features. Set up alerts and notifications to proactively identify and respond to issues before they impact users or business operations.
Scale Horizontally: Design your OpenSearch clusters to scale horizontally to manage growing data volumes and user loads. Use techniques such as shard allocation awareness and node tagging to enhance resource utilization and distribute workload effectively across the cluster.
Optimize Indexing and Query Performance: Enhance indexing and query performance by carefully designing your index mappings, outlining appropriate shard settings, and using efficient search queries. Track indexing and search latency metrics to detect performance bottlenecks and improve system performance.
Secure Your Observability Data: Implement security best practices to protect your observability data from unauthorized access and tampering. Use encryption, access controls, and audit logging to secure sensitive data and guarantee compliance with security and privacy regulations.
Regularly Review and Tune: Regularly review your monitoring and logging configurations, metrics thresholds, and alerting rules to guarantee they remain relevant and effective. Continuously tune your observability setup based on changing system requirements and usage patterns.
Hosted OpenSearch from Logit.io
With Logit.io you can gain access to numerous leading open-source solutions including OpenSearch. Logit.io’s Hosted OpenSearch removes the complexities and time needed to configure and maintain OpenSearch by offering you a service that allows you to begin creating production-ready OpenSearch Stacks within minutes.
The fully Managed OpenSearch solution from Logit.io also offers node-to-node encryption and advanced RBAC (role-based access controls) to provide a completely secure data visualization, alerting, and monitoring platform that is suitable for any cybersecurity or data centralization use case.
If you’re interested in finding out more about the extensive features and capabilities of Logit.io Hosted OpenSearch, don’t hesitate to arrange a free demo, or begin exploring the platform for yourself with a 14-day free trial.
If you've enjoyed this article why not read Cassandra vs OpenSearch or The Top 10 OpenSearch Plugins next?