
Resources, ELK
7 min read
Last updated:
This guide offers a deep dive into server uptime monitoring, focusing on the strategies and tools essential for seasoned IT professionals to implement. We’ll explore advanced metrics, fine-tune the deployment of tools like Heartbeat, and dissect integration practices with the ELK stack. Designed for technical leaders who manage complex infrastructures, this guide aims to enhance your methodologies in maintaining high availability and optimizing operational performance across your server ecosystems.
Contents
Introduction to Server Uptime Monitoring
Servers are the backbone of daily business operations and if they encounter even a short period of downtime, it can have a significant impact on the business's performance. This makes server uptime monitoring a crucial process for all organizations. Server uptime monitoring is the continuous tracking and measurement of a server's availability and performance to ensure it remains operational and accessible to users. The main objective of server uptime monitoring is to locate and address any issues that may cause server downtime or degrade its performance. By monitoring uptime, your organization can reduce service disruptions, maintain high availability, and guarantee a positive user experience.
Key Metrics to Track
- Uptime: Uptime is the percentage of time that a server is operational and accessible. It is a critical metric used to measure the reliability and availability of a server.
- Response Time: Response time measures the duration it takes for a server to respond to requests. Monitoring response time helps identify performance bottlenecks and latency issues.
- Downtime Events: Monitoring downtime events allows organizations to track the frequency, duration, and root causes of server outages, enabling them to take proactive measures to prevent future incidents.
- Error Rates: Monitoring error rates helps to identify issues such as server errors, timeouts, or connection failures that may impact service availability and user experience.
What is Heartbeat?
Heartbeat is a lightweight, open-source shipper for uptime monitoring. It can monitor services for their availability with active probing. Unlike passive log collection in ELK, Heartbeat actively pings services and collects response data, which it then sends to Elasticsearch.
For further analysis, the data that Heartbeat monitors can be shipped to numerous destinations including Logstash. Enabling you to effectively monitor the health of services running on the host in the Logit.io platform. The full configuration guide for this can be viewed here.
Installation and Setup
- Install Heartbeat: Ensure that your ELK Stack is up and running. Download and install Heartbeat from the Elastic website. It's compatible with most operating systems including Linux, Windows, and macOS.
- Configure Heartbeat: Heartbeat configurations are managed in the heartbeat.yml file. Configure it to specify the type of checks (ICMP, TCP, or HTTP) and the targets—i.e., the list of URLs or IP addresses you want to monitor.
- Setup Monitors: You can set up multiple monitors in Heartbeat. For example, to monitor a web server, you might configure an HTTP monitor to check the server’s status code and response time.
type: http schedule: '@every 10s' urls: ["http://yourserver.example.com"] timeout: 2s check.response: status: 200
- Run Heartbeat: Once configured, start Heartbeat. It will begin pinging the configured endpoints at scheduled intervals, sending data to Elasticsearch.
Integration with Elasticsearch and Kibana
- Elasticsearch: Heartbeat sends data directly to Elasticsearch, which stores the uptime data. You can configure Elasticsearch indices as needed for better data organization.
- Kibana:
Use Kibana to visualize uptime data. Kibana’s Uptime app, specifically designed for Heartbeat data, allows you to visualize uptime metrics and get insights into the availability and response times of your monitored services.
- Open the Uptime app in Kibana.
- Configure the dashboard to display data from Heartbeat.
- Analyze uptime, check durations, and statuses of all your monitored services.
Best Practices
- Regular Updates: Keep Heartbeat and your ELK stack components updated to benefit from the latest features and security updates.
- Secure Configuration: Ensure that the communication between Heartbeat, Elasticsearch, and Kibana is secure, using SSL/TLS where possible.
- Alerting: Utilize the alerting features in Kibana to set up alerts based on the monitoring data from Heartbeat, such as notifications for service downtimes.
Integrating Heartbeat with the ELK Stack provides a robust solution for uptime monitoring, offering real-time insights into the health of servers and services. By actively probing services and visualizing this data in Kibana, organizations can enhance their operational awareness and swiftly react to issues.
This setup not only ensures that your services are continuously monitored but also helps in identifying potential outages before they impact users, making it an essential part of modern infrastructure monitoring strategies.
Also, you can further streamline and enhance your uptime server monitoring by utilizing a Hosted ELK solution like Logit.io. Easily integrate Heartbeat with the ELK stack via our Hosted solution and remove the need to configure and maintain the tool yourself, we will handle this for you. Begin exploring the capabilities of our Hosted ELK solution with a 14-day free trial.
Comparison of Uptime Monitoring Tools
Whilst the ELK stack can be effectively utilized with the addition of Heatbeat for server uptime monitoring, you may be looking for an alternative server uptime monitoring tool. So, we’ve produced a comparison guide of some of the most notable server uptime monitoring tools below.
SolarWinds Server & Application Monitor
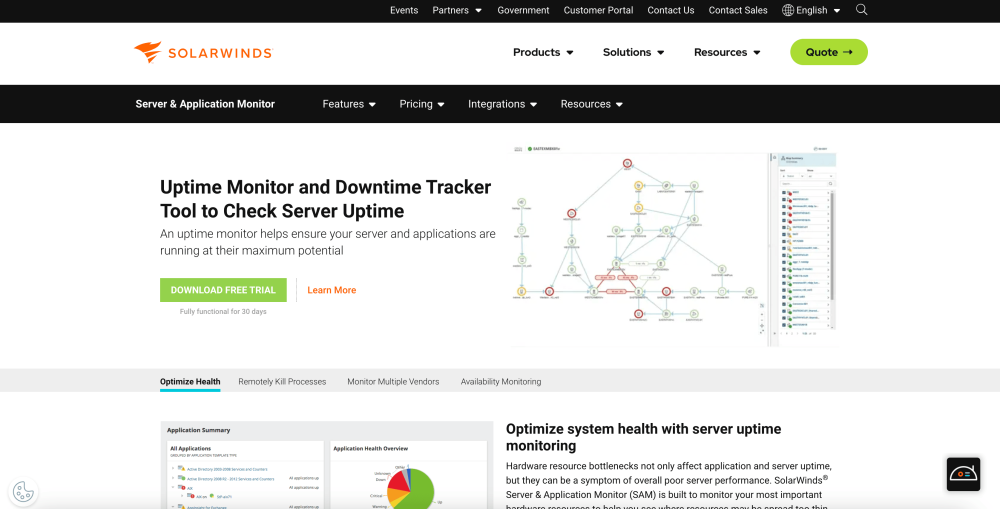 SolarWinds offers a Uptime Monitor and Downtime Tracker Tool that constantly monitors Server Uptime. The solution is designed to monitor the key metrics that help you to better understand overall server health. Also, with this tool you can remotely log in to a server and kill processes hogging server resources, helping to improve efficiency and performance. Lastly, with SolarWinds Server & Application Monitor you can track a broad variety of servers including email servers, authentication servers, databases, and web servers, as well as others.
ManageEngine OpManager
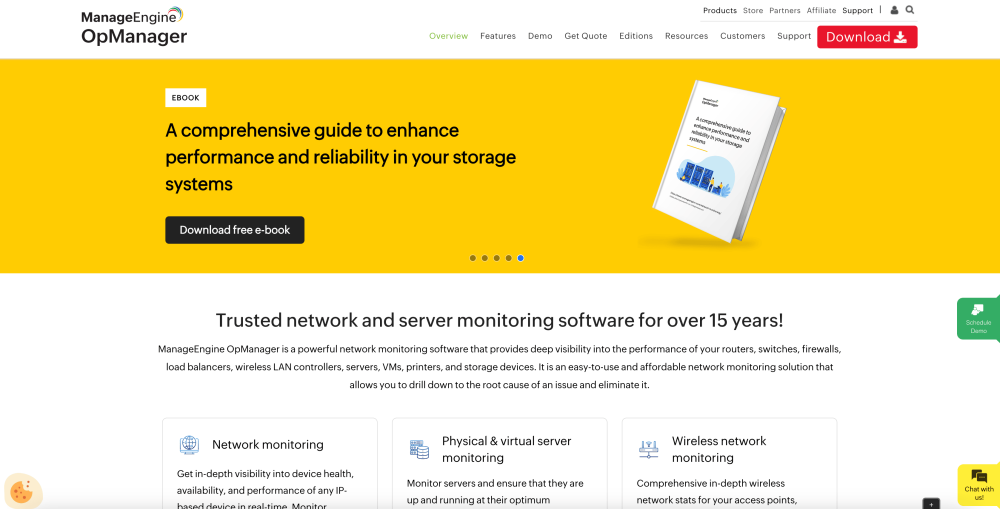 The next server uptime monitoring tool is ManageEngine OpManager. OpManager is a Linux and Windows server uptime monitor, that constantly communicates with servers using different protocols like the WMI and SNMP to proactively attain information regarding the server's health and availability. Also, the solutions offer powerful dashboards and reports that make analysis and the response to issues quick and painless.
Pingdom
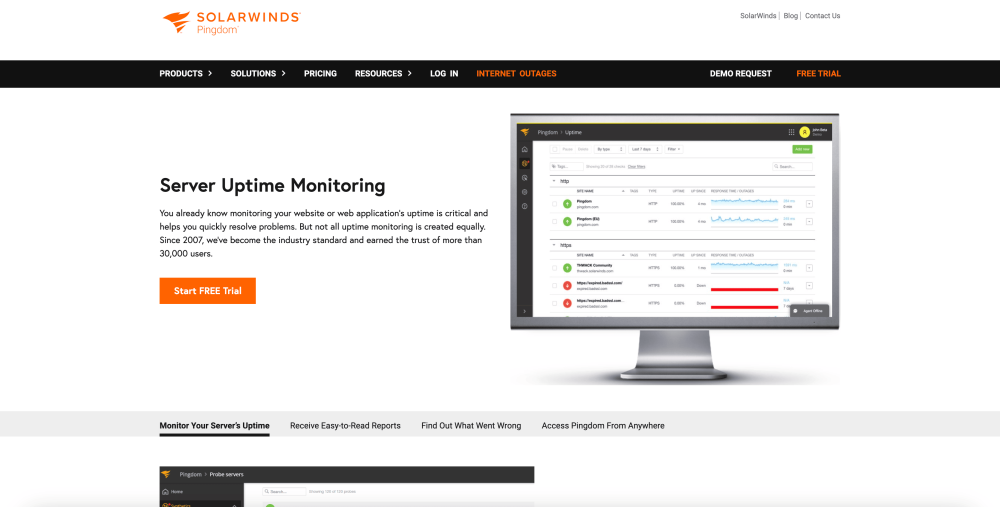 Pingdom is another solution from SolarWinds that offers extensive server uptime monitoring capabilities. The solutions automatically tests your website every minute from over a hundred locations around the world to verify your server is operating as expected. If a server issue does arise, you will be sent an instant alert, allowing you to act quickly and fix the problem. As well as this, with Pingdom you can log in to the solution on your laptop, tablet, or mobile device from anywhere in the world, so you are always able to respond promptly to issues.
LogicMonitor
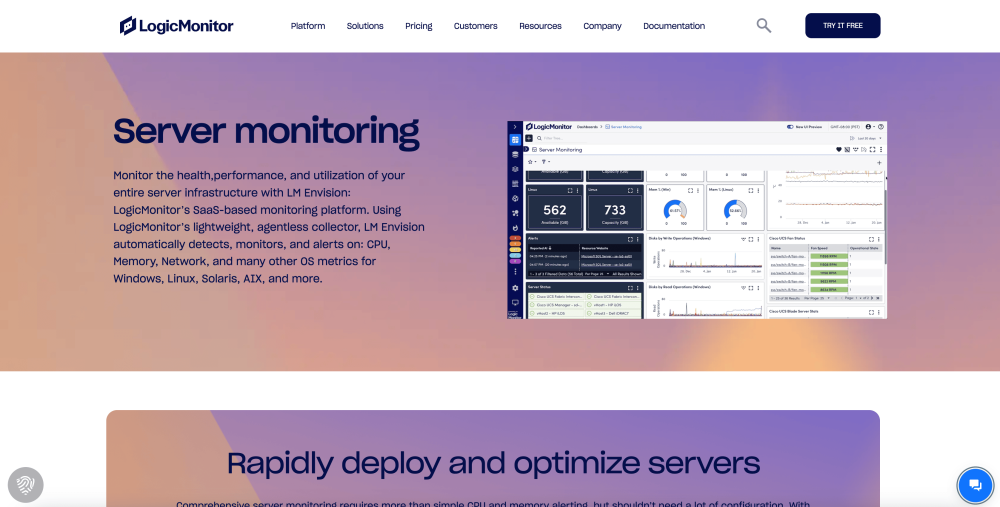 The last server monitoring tool included in our comparison guide is LogicMonitor. The solution will automatically detect, monitor, and alert on CPU, Memory, Network, and many other OS metrics. To ensure you respond quickly to issues you can utilize the tools automated reporting and ITSM integrations with ServiceNow, Ansible, PagerDuty, Connectwise, and Slack. Lastly, you can attain deeper insights with fast, fully customizable, and scalable, pre-built dashboards.
FAQ Section
What are the different types of notifications provided by server uptime monitoring tools? Uptime monitoring tools have the capability to notify you through different channels in case your websites or servers encounter downtime or issues. These alerts can be delivered via SMS, email, Slack, Discord, or webhook.
What are some common causes of server downtime? Common causes of server downtime include hardware failures, software bugs or crashes, network outages, security breaches, excessive traffic spikes, and maintenance activities.
How can I improve server uptime? To improve server uptime, implement best practices such as proactive monitoring, regular backups, redundancy and failover configurations, load balancing, disaster recovery planning, and implementing security measures to prevent cyber attacks.
What role does server uptime monitoring play in incident response? Server uptime monitoring plays a critical role in incident response by providing early detection of issues, facilitating rapid response and resolution, minimizing downtime, and ensuring service availability and reliability.
How does server uptime monitoring work? Server uptime monitoring tools periodically send requests to the server and measure its response time. If the server fails to respond within a specified time frame or returns an error, the monitoring tool triggers an alert to notify administrators of the downtime.
Why is it critical to monitor server uptime? An uptime server monitor safeguards continuous business operations by vigilantly monitoring critical server performance parameters. This proactive approach ensures that servers maintain optimal service delivery without any interruptions. Also, server failures disrupt service delivery, negatively impacting customer satisfaction and retention. To ensure a seamless user experience and sustain revenue generation, it's imperative to monitor server uptime using dedicated monitoring tools.
If you've enjoyed this article why not read What is Server Monitoring or The Top 10 Server Monitoring Tools next?