
Resources
5 min read
Effectively visualizing and analyzing data is a crucial aspect for every organization and without the appropriate tools, achieving this is particularly difficult. So, many users opted for Tableau to fulfill their required visualization capabilities. Tableau is a powerful and widely used data visualization and business intelligence (BI) tool designed to assist users in seeing and understanding their data. The solution enables users to connect to various data sources, analyze data, and create interactive, shareable dashboards and reports.
However, whilst Tableau has emerged as a common choice, numerous users have felt dissatisfied with the service, particularly since the acquisition by Salesforce. Some users have stated that they have seen a shift in the tools support philosophy, post-Salesforce acquisition. While numerous other users have shown their dissatisfaction with the speed of the tool with these users highlighting how they’ve encountered long loading times. Lastly, another issue that users have with Tableau is how expensive it is, this combined with the issues stated above has left many users looking for Tableau alternatives.
On the bright side, there is a broad range of visualization and business intelligence tools, similar to Tableau available for users to utilize. Because of this wide variety, it can be challenging and time-consuming to find the perfect solution for an organization. So, to assist you with this, this article will outline a range of best possible Tableau alternatives.
Contents
Tableau Alternatives
Hosted OpenSearch from Logit.io
Logit.io's Hosted OpenSearch is a managed service for OpenSearch, offering search, analytics, and visualization capabilities without the overhead of infrastructure management. It provides scalability, security, and high availability, as well as automated maintenance, updates, and backups. This solution allows your organization to extract insights from its data without getting bogged down by operational complexities.
Request a Demo
Want to learn more about Logit.io's powerful observability platform? Book a demo and we'll walk you through the extensive capabilities and discuss your requirements in detail.
ThoughtSpot
The first Tableau alternative included in our list is Thoughtspot, a visualization tool offering fast AI-powered insights. This solution focuses on speed and ease of use and enables users to search in natural language to facilitate fast fact-driven decision-making. As well as this, thoughtSpot provides Liveboards, a real-time data visualization feature that offers a live and fully interactive view of your data. Enabling users to track business metrics with personalized, actionable insights.
Microsoft Power BI
Microsoft Power BI is a business analytics tool that provides visualization and sharing of insights in data. Its main features include connectivity to several sources through interactive dashboards, real-time data monitoring, and robust reporting. Advanced analytics can be applied to create custom visualizations with integration, while AI simplifies collaboration due to the integration with Microsoft Office 365.
Qlik Sense
Qlik Sense is a visualization tool that combines powerful dashboards with AI to offer deeper insights. With this tool users can make selections freely in all objects, in any direction, to refine context, make discoveries, and gain instant calculations at scale. As well as this, the tool has AI and ML built-in to deliver a full range of uniquely integrated augmented analytics capabilities. Some of these features include automated insight generation, AI-assisted creation and data prep, and AutoML & predictive analytics.
Sisense
Sisense is another Tableau alternative data visualization tool that utilizes AI-powered analytics to enhance capabilities. The solution allows users to simply prepare and examine complex data, covering the full scope of analysis from data integration to visualization. Also, users can visualize AI and ML-augmented analytics with charts and graphs, or explore the data through NLQ-interpreted questions and NLG/GenAI-created answers.
Google Looker Studio
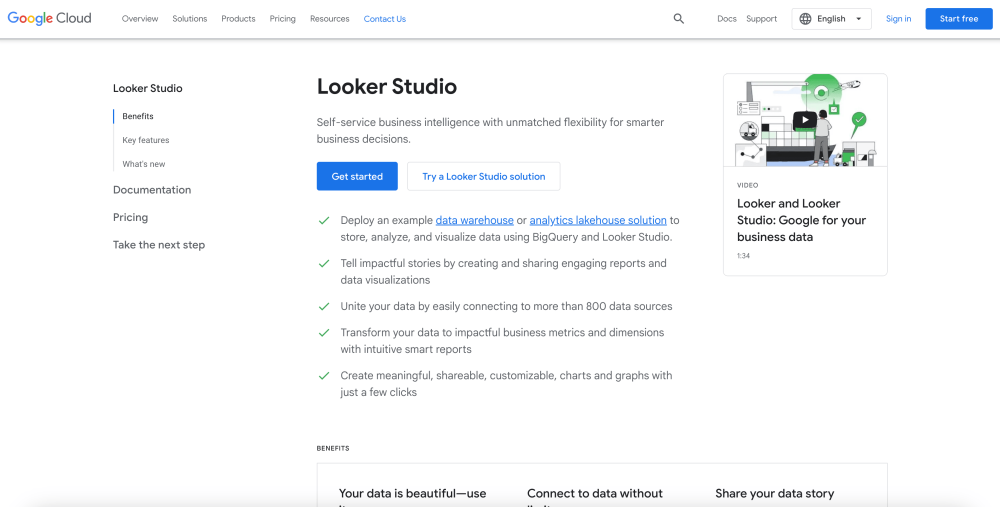
Google Looker Studio is a web-based data discovery platform that delivers the advanced capabilities data analysts need, while also enabling business users across the organization to independently find insights. This data visualization tool is designed to be intuitive and easy to use. The report editor features simple drag-and-drop objects with fully custom property panels and a snap-to-grid canvas.
Astrato
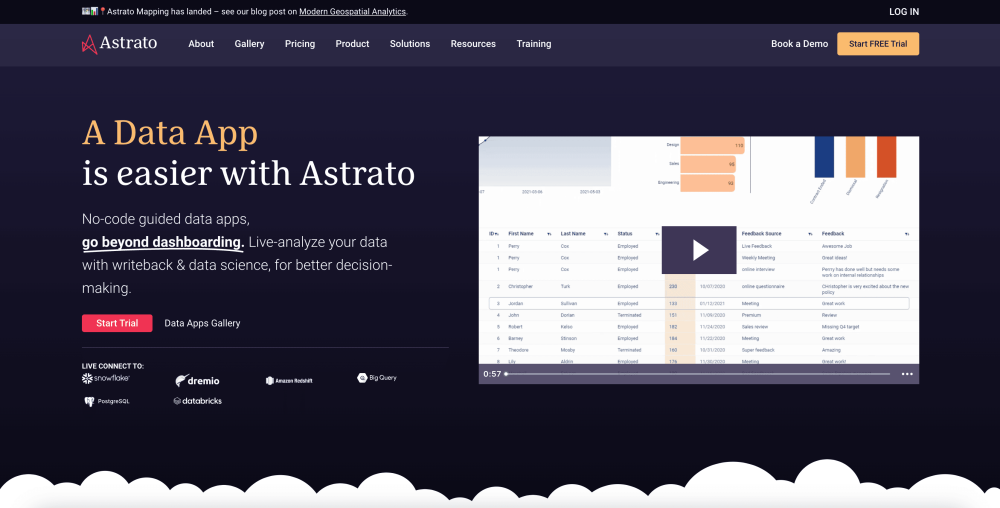
Astrato is a data analytics and visualization solution that allows users to live-analyze their data with writeback & data science, for enhanced decision-making. With this solution, users can visualize data in Snowflake, Databricks, BigQuery, Dremio, Redshift, and Postgres. As well as this, Astrato offers generative AI which powers Astrato insights which offers clear explanations and recommendations for trends and actions, without coding.
Metabase
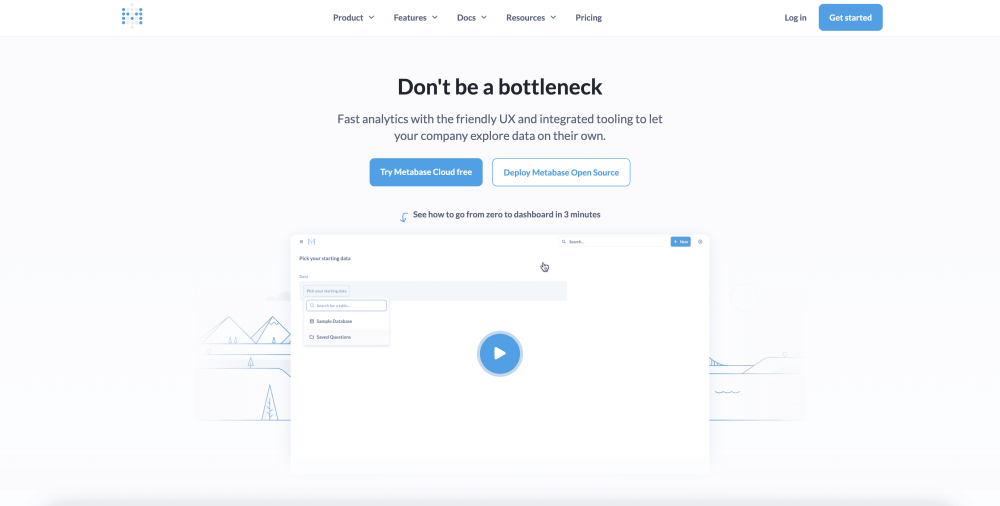
Metabase, an open-source business intelligence visualization tool, serves as an effective Tableau alternative. The solution offers users the ability to connect to their data stack and showcase their data in a simple familiar interface with spreadsheet-like controls such as filtering and sorting. With Metabase, users can dive deeper with a simple and easy-to-learn visual query builder.
Domo
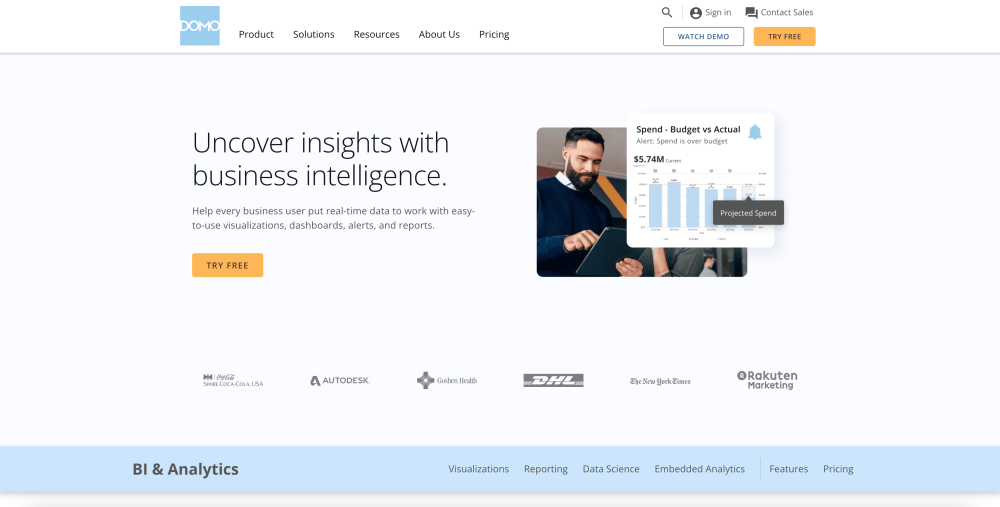
The next Tableau alternative included in our list is Domo, a simple-to-use data visualization tool. With Domo, users can attain reports out of spreadsheets and into real-time data dashboards, which can then be securely shared with colleagues, and set up alerts to notify teams regarding any data changes. Also, users can utilize AI and machine learning to understand how changes in your data are likely to affect your business outcomes.
Mode
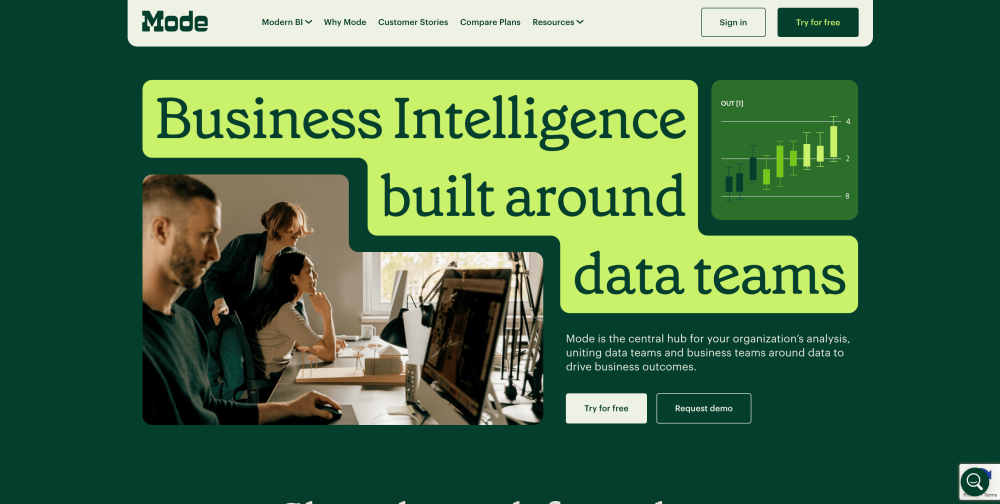
Mode is the analytics layer for a user’s data stack, it offers data visualization capabilities and supports ad hoc alongside self-serve reporting. The ad hoc analysis provides an SQL editor that enables users to dive into data using SQL and rapidly iterate through queries to deliver results. With self-serve reporting users can utilize interactive dashboards that anyone can use when they've got a follow-up question, no tickets required.
Oracle Analytics Platform
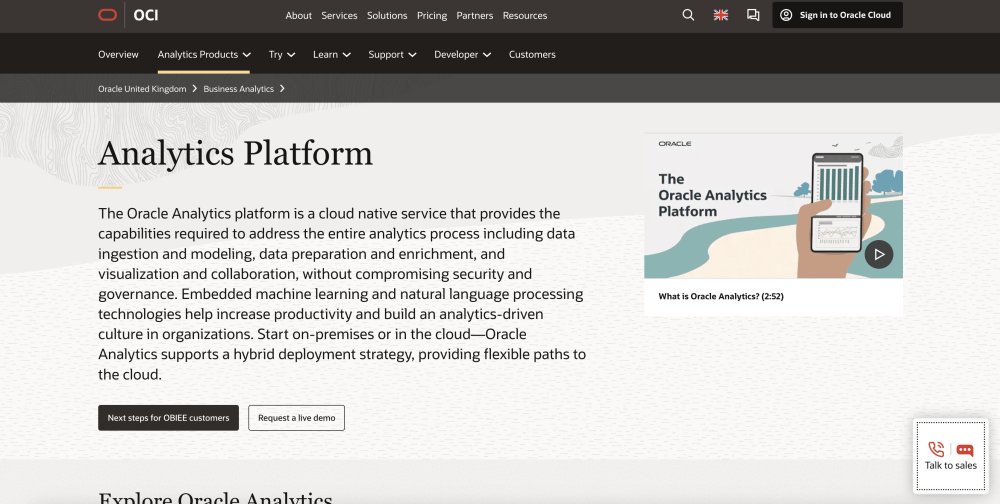
Oracle Analytics Platform hosts a self-service analytics environment in the cloud for simplification of analysis, visualization, and reporting. Artificial intelligence (AI) powers data connectivity into a wide base of sources, advanced analytics, (through the integration of machine learning), and intuitive data visualization. Also, users can build interactive dashboards, conduct predictive analytics, and collaborate seamlessly across teams.
Amazon QuickSight
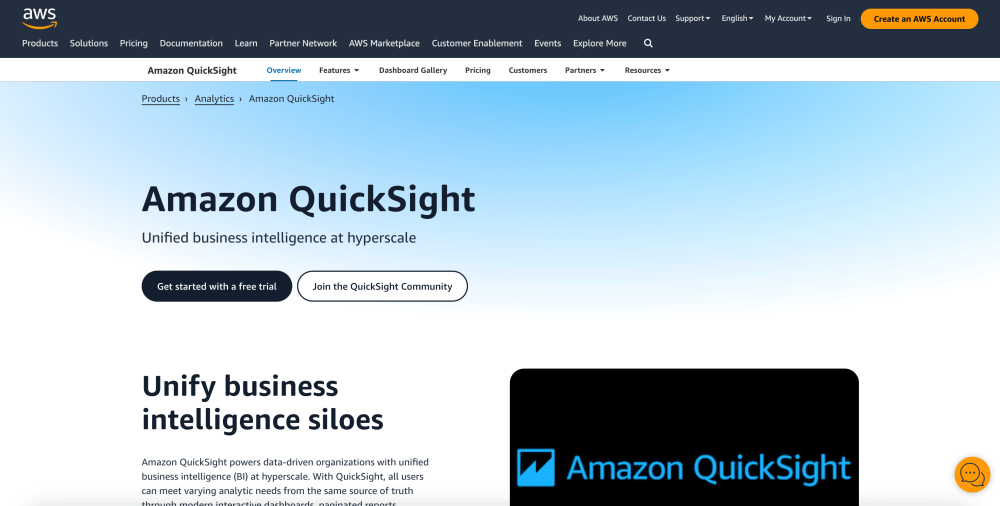
Amazon QuickSight is a cloud-powered business intelligence service, scaled for the power of fleets, where users can build and share rich visual, interactive dashboards. It offers several advanced features, including fast integration of data from multiple AWS services and external sources, machine learning insights that include anomaly detection and forecasting, and native language querying for ease of interaction with data.
OpenSearch
OpenSearch is a newer solution that can also be used as a Tableau alternative for data visualization and analysis due to the intrinsic competencies in data ingestion, search, and its capability for visualization. Here is how you can leverage OpenSearch as an alternative.
Data Ingestion
Use OpenSearch's tools, Logstash, Beats, or custom ingestion pipelines, to easily ingest data from several sources. These include databases, cloud storage, and APIs. Perform, at ingress, any source transformation and preprocessing as needed.
Data Querying and Analysis
Fetch and analyze data using OpenSearch's query language, which supports full-text search, aggregations, filtering, and many other features. OpenSearch also supports SQL-like queries with the SQL plugin.
Visualizations with OpenSearch Dashboards
Create a wide variety of visualizations within OpenSearch Dashboards, from line and bar charts to pies, maps, and many more. Also, design interactive dashboards that an end-user can further drill down into, apply filters, and explore insights at greater depth.
If you've enjoyed this article why not read The Top 8 Data Analysis Mistakes to Avoid or The Top 30 Business Intelligence (BI) Tools next?