
Resources
4 min read
Web analytics dashboards are essential tools for businesses looking to enhance their online presence, optimize user experience, and achieve their wider business objectives. By supplying actionable insights and facilitating data-driven decision-making, these dashboards help businesses stay competitive in today's digital landscape.
Web analytics dashboards are powerful tools that assist users in visualizing the performance and health of their website. However a common issue that users face is deciphering what metrics to monitor and therefore what web analytics dashboard to use. There are numerous examples of web analytics dashboards currently available so choosing the most appropriate example for your organization can be a time-consuming task. Therefore, to help you with this we have listed some of the best web analytics dashboard examples available.
Contents
Geckoboard Google Analytics 4
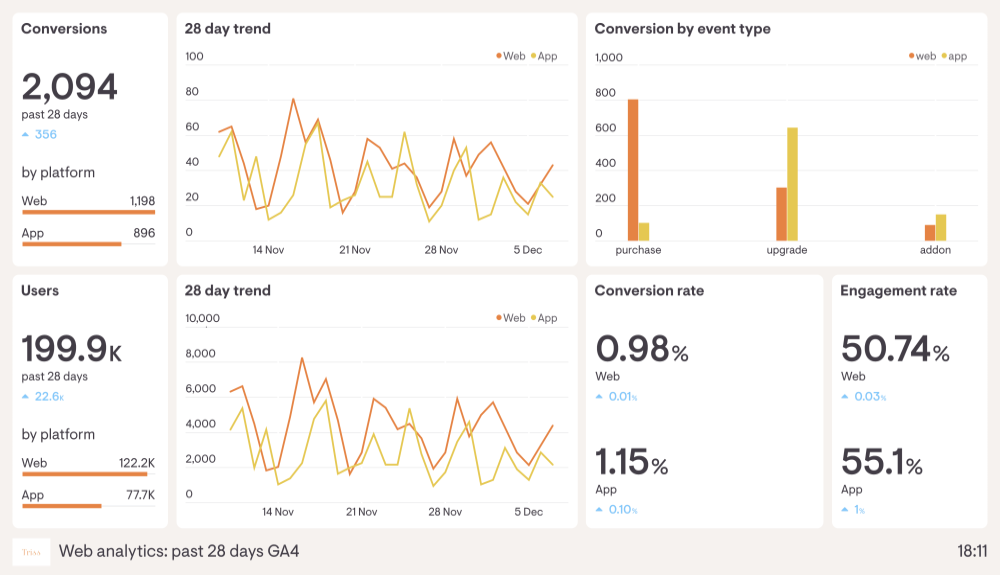
From July 1st 2023, Google universal analytics properties stopped processing new data and by July 1st 2024 all customers will lose access to the Universal Analytics interface. This has meant that customers have had to get used to the new Google Analytics 4 and the new and different types of data that it processes. This dashboard, created by Geckoboard, visualizes data collected on Google Analytics 4 so your team can rapidly and easily monitor user engagement and the performance of their platforms. The dashboards focal point are conversion rates and website engagements.
Tableau Web Analytics
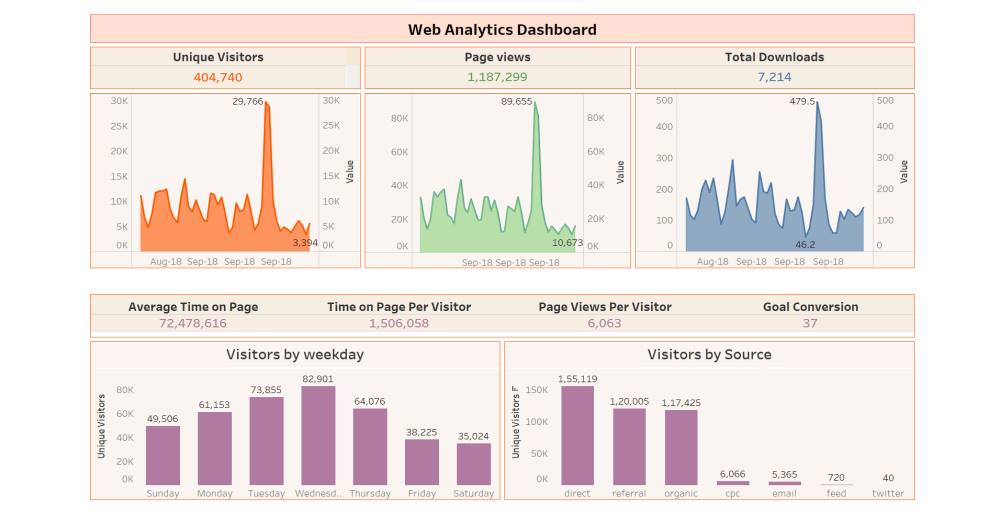
For this dashboard example, Tableau was utilized to visualize and analyze web analytics data. Tableau is an analytics platform that aims to make it simpler and quicker for users to explore and manage data, to discover and share insights that can drive accurate data-driven decisions. With this dashboard you can view metrics such as unique visitors, page views, and total downloads.
NGINX Analytics
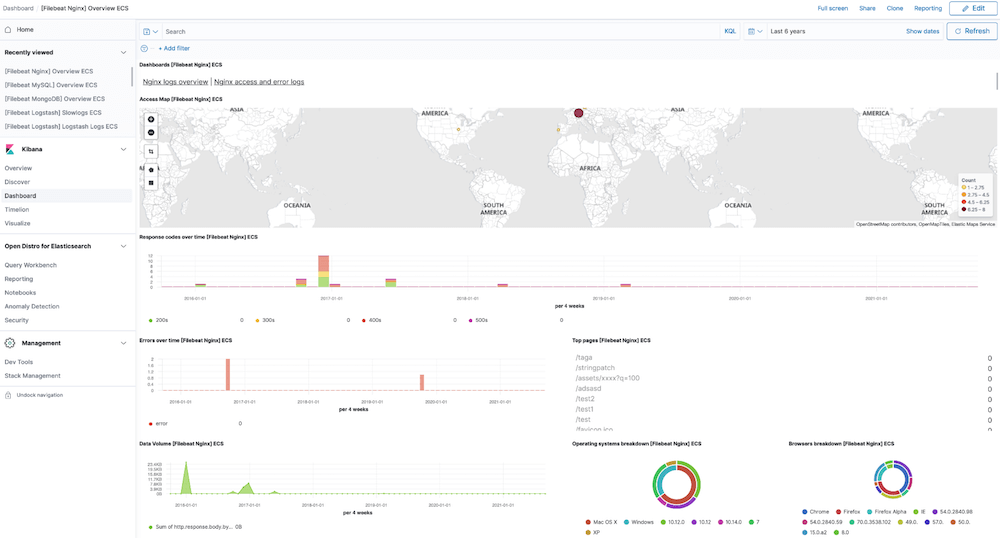
Logit.io enables you and your team to design various web analytics dashboards to monitor critical metrics. For this example, NGINX web server metrics are visualized. NGINX is an open source software for web serving, reverse proxying, caching, load balancing, media streaming, and more. With this dashboard you can view metrics such as response code over time, operating systems breakdown, and top pages.
Case Foundation Google Analytics and Mailchimp
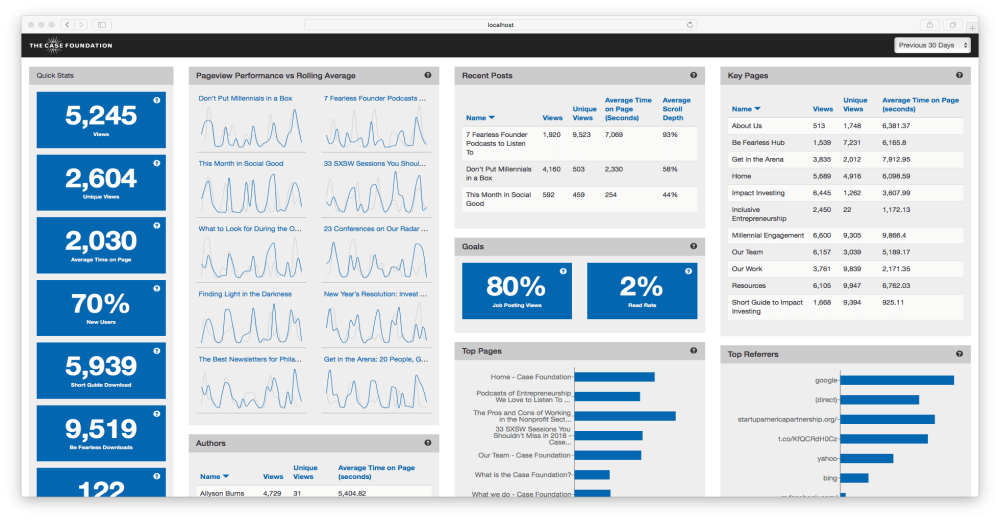
This dashboard, developed by Case Foundation, gathers data from numerous websites via Google Analytics and Mailchimp APIs to provide a comprehensive overwiew of the organizations digital performance. The focal point of this dashboard is the pageview performance vs rolling average. The dashboard presents a broad range of metrics such as unique views, recent posts, and authors.
Geckoboard Website Launch
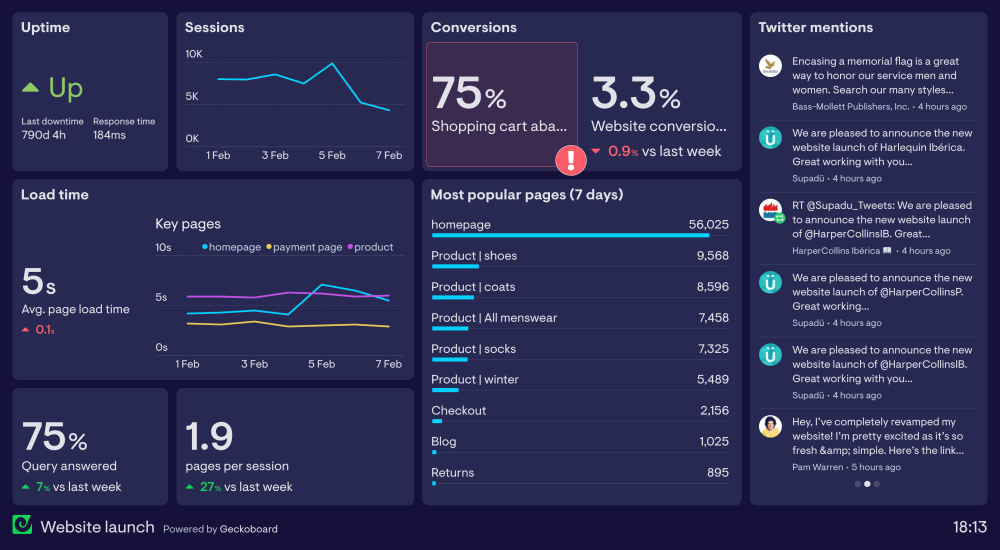
A dashboard's only use isn't just for continuous monitoring and day-to-day operations, they can also be effectively utilized to monitor one-off or otherwise limited time events such as the launch of a new website. Using this dashboard allows users to easily locate issues that could be impacting user experience and rectify them promptly. This dashboard offers metrics such as conversions, uptime, and sessions.
Cooladata Business Insights
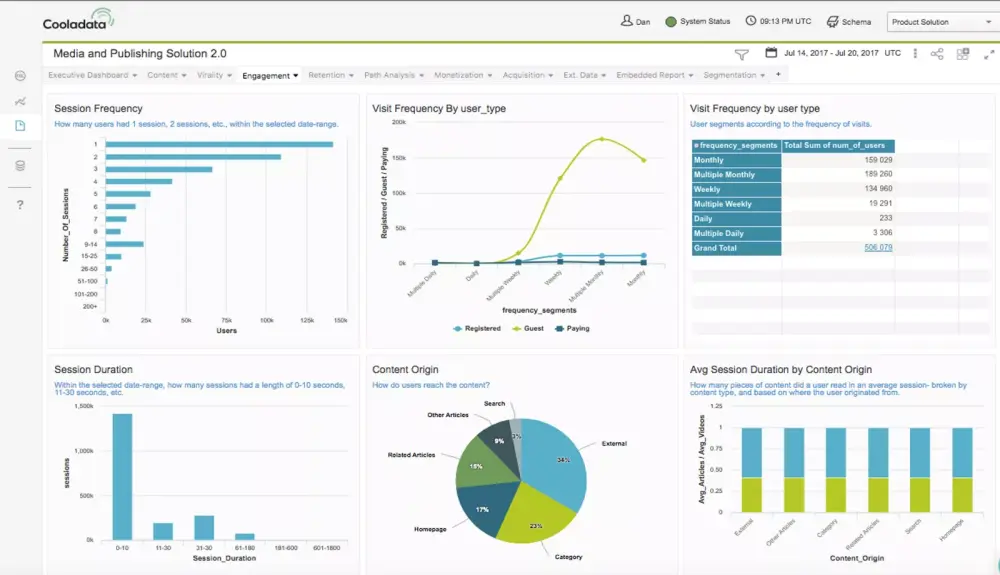
This web analytics dashboard is for business insights and uses key datasets based on business objectives to improve business decisions. The dashboard was built on Cooladata, a big data behavioral analytics platform for online web and mobile applications. With this dashboard you can visualize metrics such as visit frequency, session frequency, and session duration.
Dashthis Web Analytics
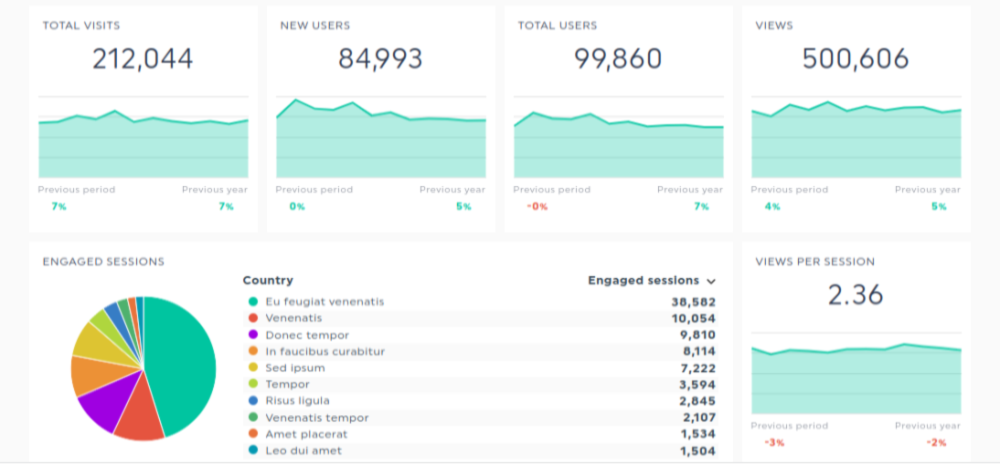
For this web analytics dashboard example Dasthis was used. Dashthis is an automated and simple-to-use marketing reporting tool designed to assist marketers save hours of work and create reports. The dashboard enables you to effectively monitor the performance of your website by monitoring metrics such as new users, engaged sessions, and views per session.
Cyfe Google Analytics
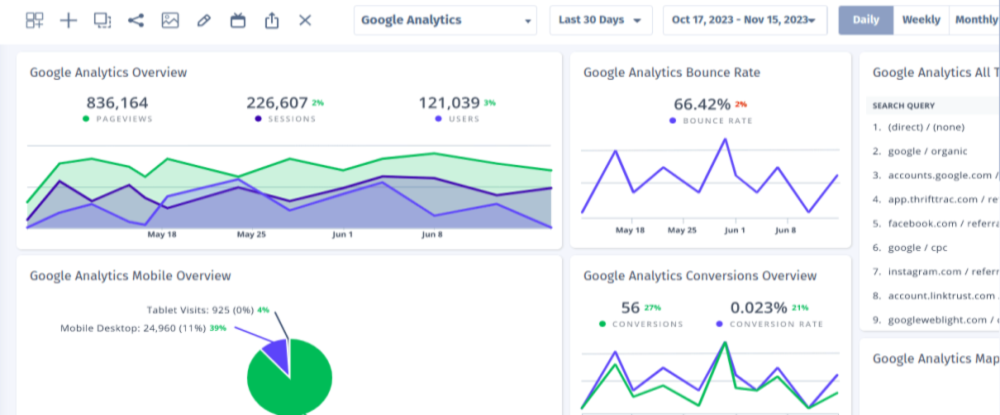
Using Cyfe, this dashboard enables users to attain a comprehensive view of their Google Analytics data that is being pulled from their website. This allows for insights to be gained and data-driven decisions to be outlined. This dashboard presents a range of metrics such as bounce rate, conversions, and sessions.
Dashthis eCommerce
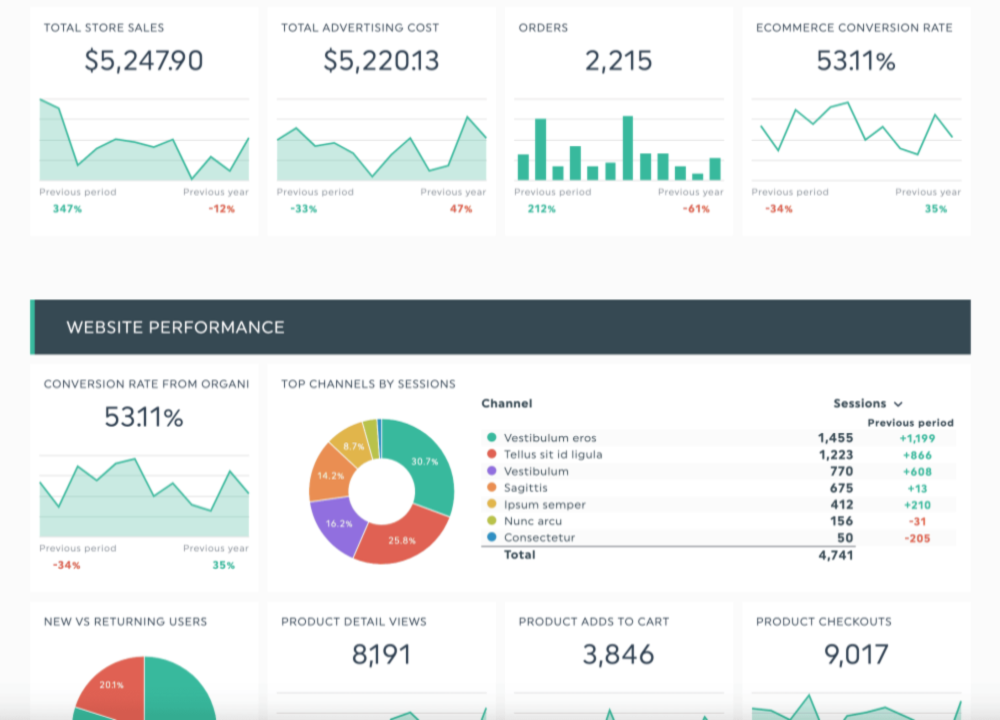
This web analytics dashboard is another example designed by Dashthis, but this dashboard presents metrics relating to an eCommerce website. Monitoring eCommerce metrics is a vital activity as it can help you to gauge inventory needs for the future, as well as clearly highglight your customer engagement. With this dashboard you can view numerous metrics, including eCommerce conversion rate, product checkouts, and total store sales.
Coupler.io Web Analytics
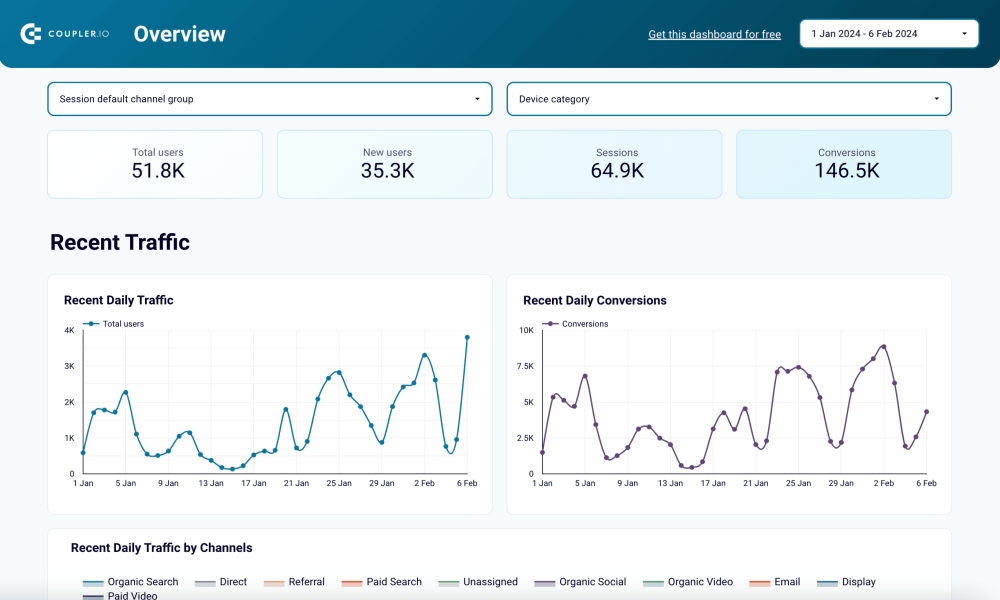
By utilizing this Coupler.io web analytics dashboard you can easily monitor numerous metrics relating to the performance of your website. Coupler.io is a full-scale solution for data management, including data integration, automation tools, and data analytics services. With this dashboard you can view a range of metrics including but not limited to total users, sessions, and conversions.
If you've enjoyed this article why not read the Leading Jaeger Dashboard Examples or the Top 15 New Relic Dashboard Examples next?