
Resources
5 min read
A vital aspect of working in IT is that you need to effectively monitor a broad range of KPIs and metrics to ensure the smooth operation of your IT infrastructure. IT dashboards streamline this process as they are specialized dashboards designed to offer insights and track key performance indicators (KPIs) related to numerous aspects of IT operations and infrastructure. IT dashboards encompass numerous activities within information technology such as infrastructure monitoring, incident management, service level agreements (SLAs), and security monitoring. These dashboards are utilized by IT professionals, managers, and stakeholders to efficiently manage and enhance IT systems, services, and resources.
With the numerous uses of IT dashboards they can provide significant advantages to your team, an example being real-time visibility. These dashboards offer real-time visibility into the performance, health, and status of IT systems, networks, applications, and services. This allows your IT team to quickly identify issues, track critical metrics, and respond promptly to incidents or anomalies, reducing downtime and service disruptions.
The various uses and advantages highlight how IT dashboards can improve your IT operations. To further comprehend this, we will outline some of the leading IT dashboard examples within this article.
Contents
- Bold BI Issue Tracker
- Logit.io Kubernetes Metrics
- Geckoboard AWS Expenditure
- Datapine Cybersecurity
- BGP and Web Application Monitoring
- Metabase IT Infrastructure Monitoring
- Tarantool Application and Database Server Monitoring
- CheckMK Kubernetes Cluster Monitoring
- Datapine IT Issue Management
- NanoNodeGraphics Net Data Application Monitoring
- SlideTeam Cybersecurity with Risk and Compliance
- Metabase IT Compliance
- Geckoboard IT Team
Bold BI Issue Tracker
![]()
Effectively monitoring issues is a vital process as this enables teams to act promptly when issues arise. With this issue tracker dashboard, created by Bold bi, you gain a comprehensive overview of your team's created and closed issues, allowing for efficient issue resolution. This dashboard provides numerous metrics relating to your issues such as issues (resolved and unresolved), issues by status, and average issue age.
Logit.io Kubernetes Metrics
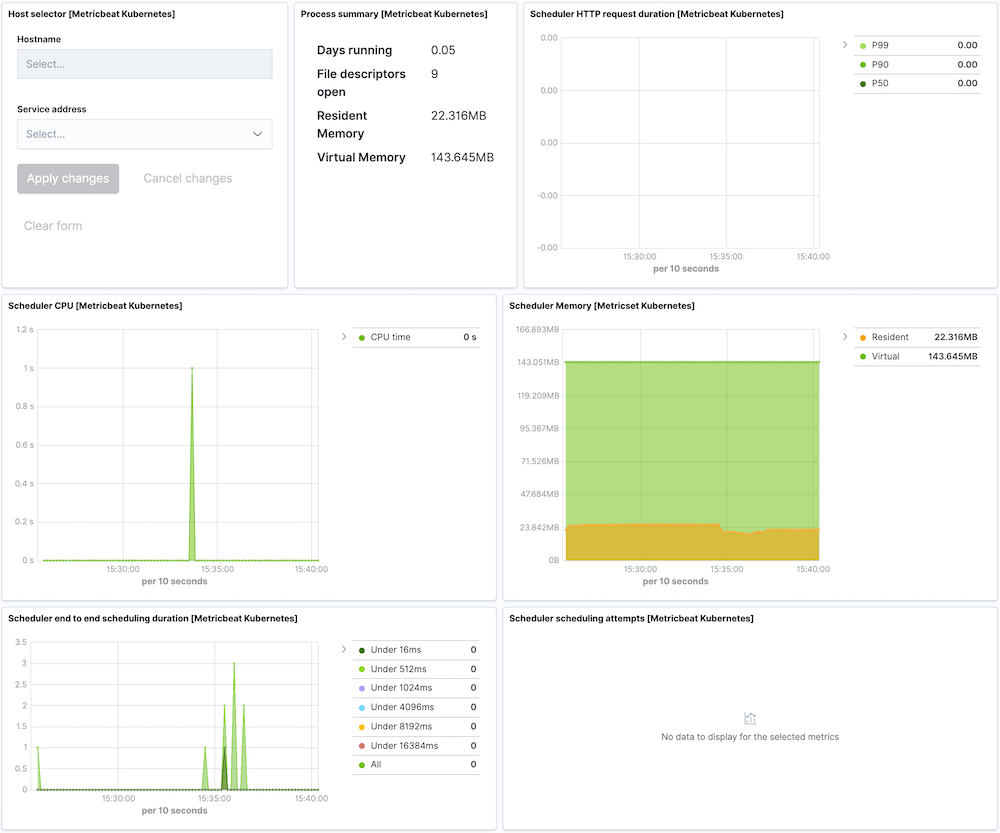
With this IT dashboard you can visualize various metrics relating to your Kubernetes container. This Kubernetes metrics dashboard has been designed with Logit.io, an observability platform built on hosted OpenSearch & Grafana, that provides you with the abilitiy to produce numerous IT dashboards for varying needs. Find out more about Logit.io's comprehensive platform here. With this dashboard you can view multiple metrics such as scheduler CPU, scheduler memory, and process summary.
Geckoboard AWS Expenditure
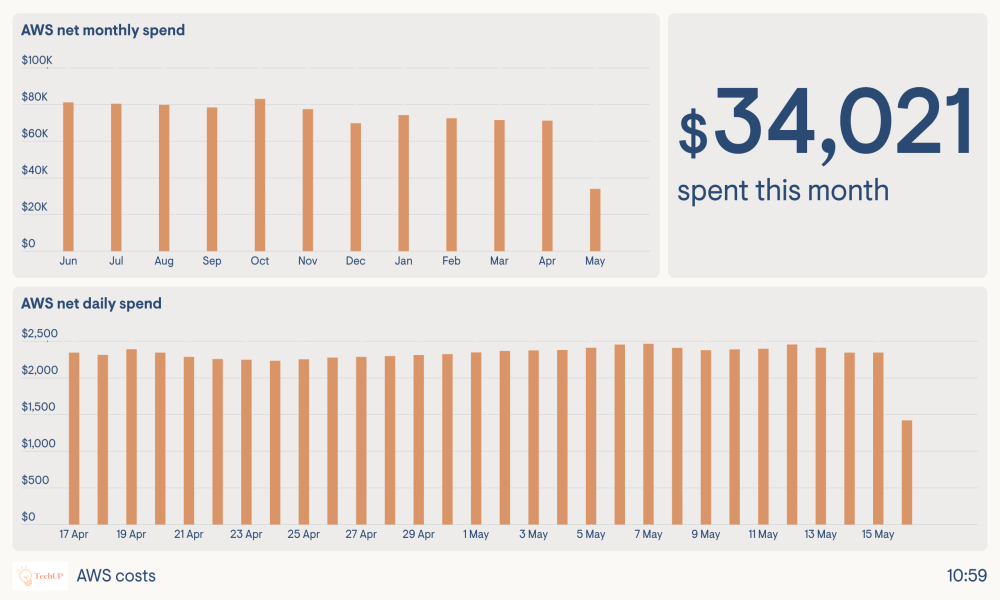
This IT dashboard provides a simplified view of your Amazon Web Services expenditure. If your organization utilizes AWS then AWS spending could represent a significant proportion of your overall IT budget. It’s therefore vital that you keep on top of how much you are spending, especially as updates for AWS billing information are infrequent. This dashboard highlights metrics like AWS net daily spend, AWS net monthly spend, and the amount spent this month. These insights help you with AWS cost optimization, ensuring you can identify areas to reduce expenses and improve efficiency.
Datapine Cybersecurity
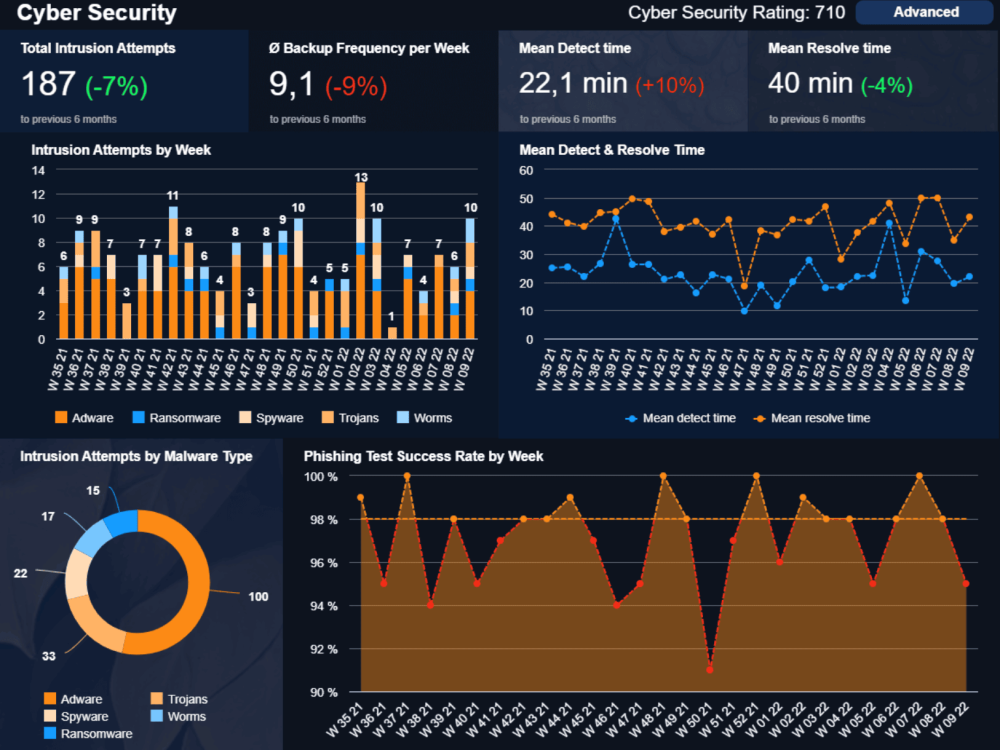
Conducting cybersecurity is a crucial practice as it helps protect sensitive data from unauthorized access, theft, or manipulation and can assist in preventing and mitigating the impact of cyber attacks, such as malware infections, and phishing scams. This dashboard by Datapine helps your team ensure the security of your IT infrastructure by monitoring metrics such as total intrusion attempts, mean detect time, and mean resolve time.
BGP and Web Application Monitoring
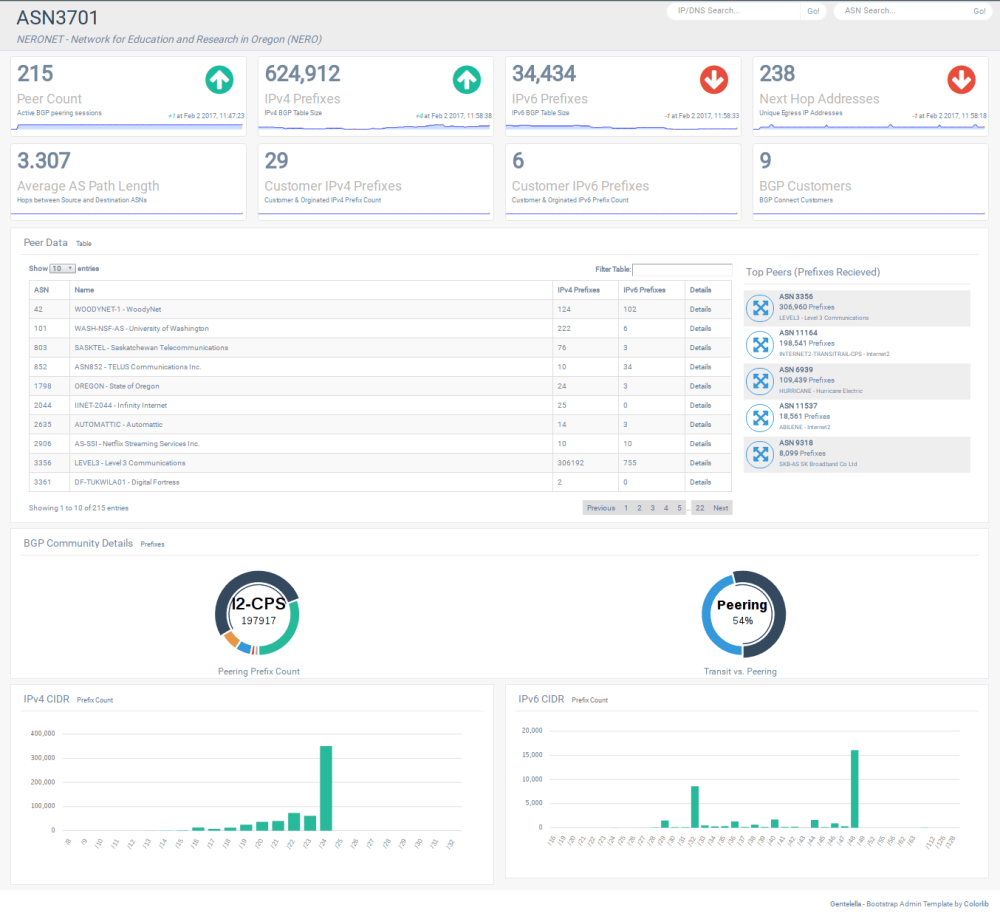
Border Gateway Protocol (BGP) is the routing protocol for the Internet, it picks the most efficient routes for delivering Internet traffic. This dashboard utilizes GoBGP to enable users to monitor the BGP to highlight and troubleshoot issues in a network's routing infrastructure. With this dashboard, you can view a range of metrics including but not limited to IPv6 prefixes, average AS path length, and peer data.
Metabase IT Infrastructure Monitoring
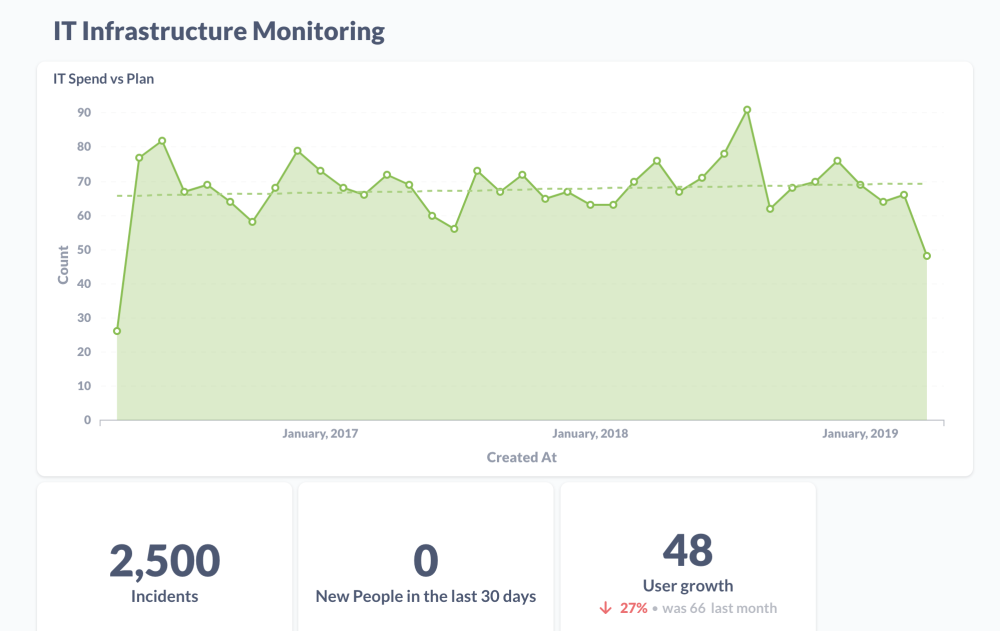
IT infrastructure monitoring is another vital process ensures that your IT team can track the health of hardware and software that powers your organization. This IT dashboard for IT infrastructure monitoring was designed with Metabase, an open source business intelligence solution that enables users to create charts and dashboards utilizing data from various databases and data sources. This dashboard highlights metrics like IT spend vs plan, number of incidents, and user growth.
Tarantool Application and Database Server Monitoring
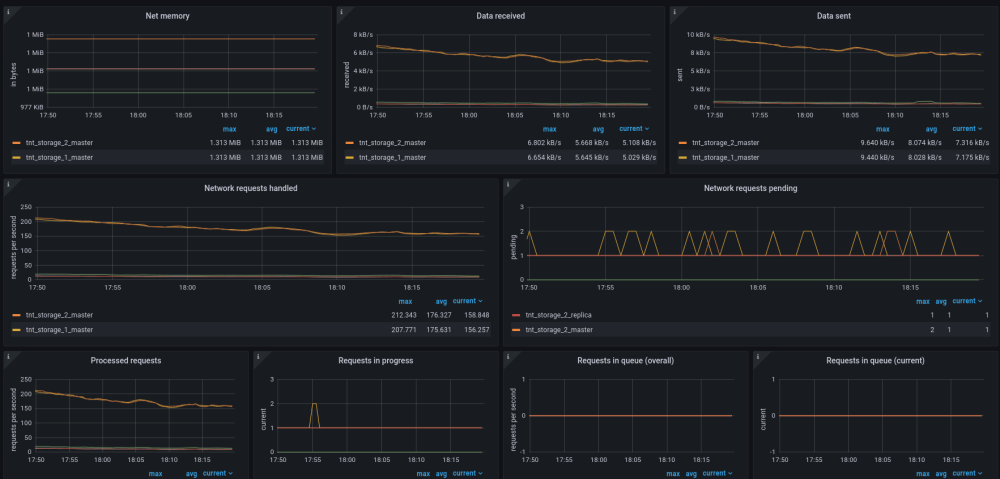
With this dashboard, you can effectively track your Tarantool application and database. Tarantool is an in-memory computing platform with a flexible data schema, commonly utilized for creating high-performance applications. The dashboard, built with Grafana, highlights numerous metrics relating to your Tarantool application such as net memory, data received, and network requests pending.
CheckMK Kubernetes Cluster Monitoring
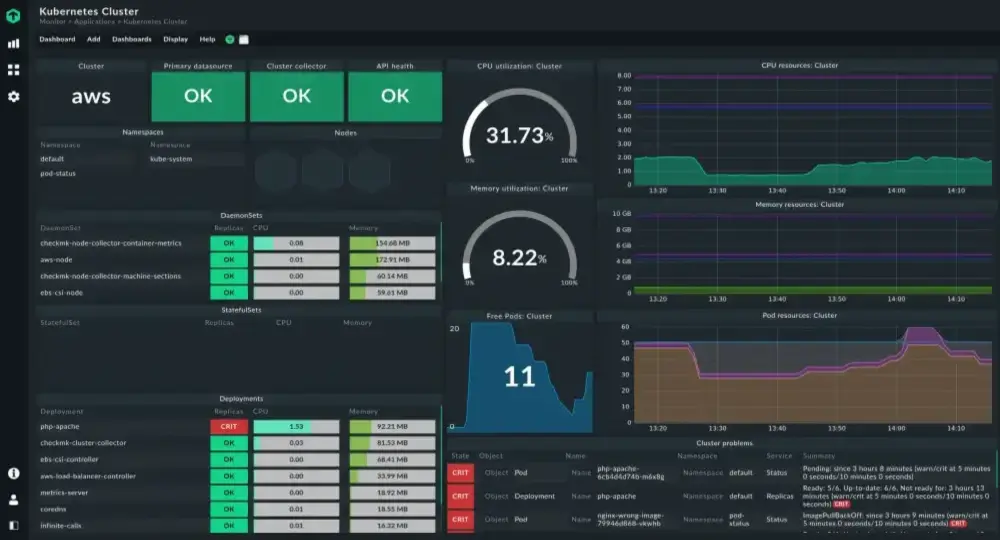
This dashboard, created with CheckMK a software solution developed in Python and C++ for IT Infrastructure monitoring, enables your team to monitor your Kubernetes cluster. With this dashboard, you’re able to view a variety of metrics relating to your Kubernetes cluster like CPU utilization, API health, and memory utilization.
Datapine IT Issue Management
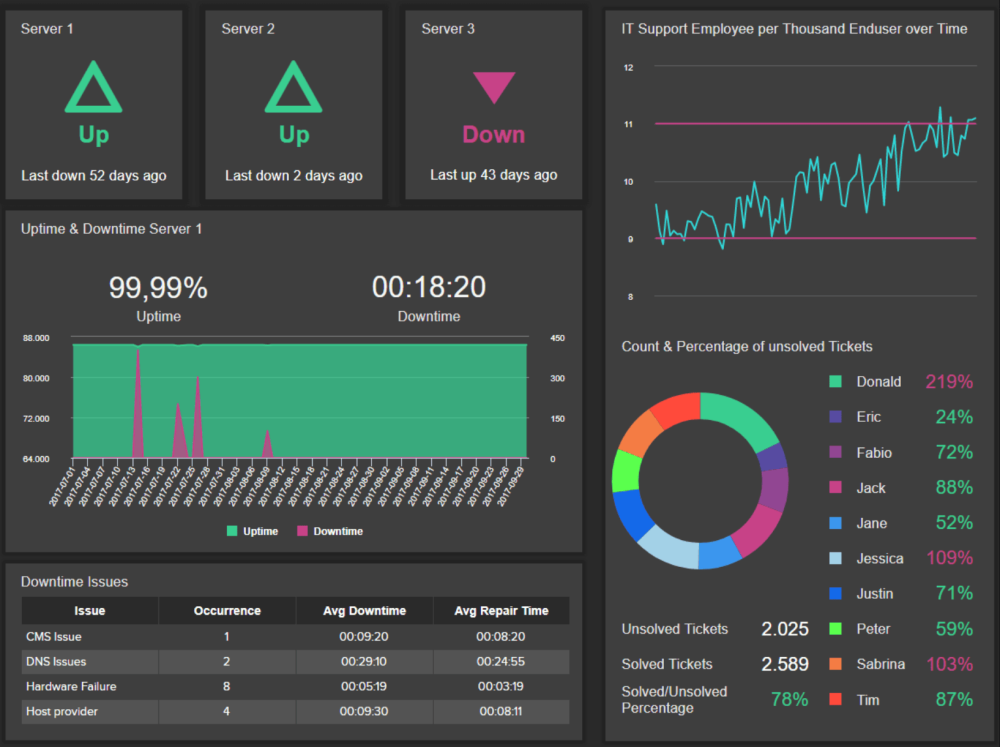
This IT dashboard is another example of issue management. However, this dashboard differs from Bold BI issue tracker as it focuses on server-related issues. Server management is vital as conducting effective server management practices ensures that your IT systems function at their maximum potential. With this dashboard, you can visualize a variety of metrics such as uptime & downtime, downtime issues, and the number of unsolved tickets.
NanoNodeGraphics Net Data Application Monitoring
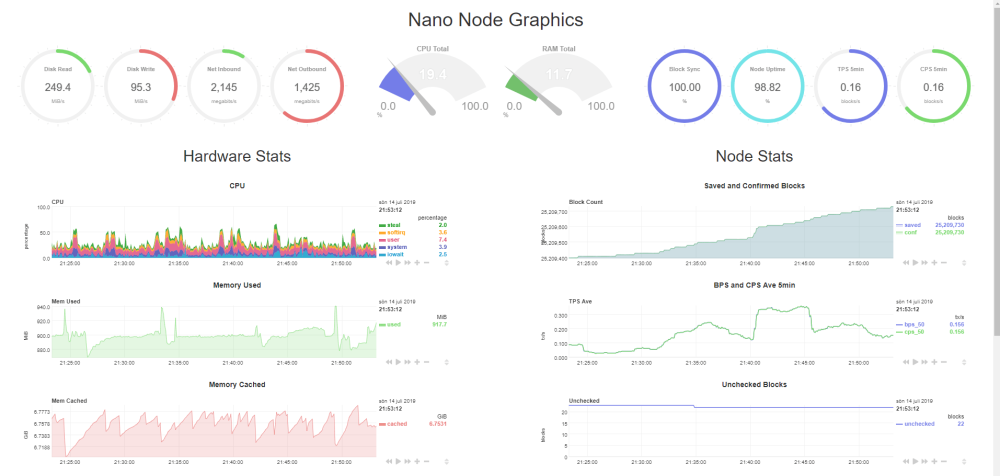
This IT dashboard was built with NanoNodeGraphics and presents data pulled from a Net Data application and nano node monitor API. Netdata provides users with the ability to monitor their servers, containers, and applications, in high resolution and in real-time. With this IT dashboard, you can view metrics such as CPU usage, RAM usage, and saved and confirmed blocks.
SlideTeam Cybersecurity with Risk and Compliance
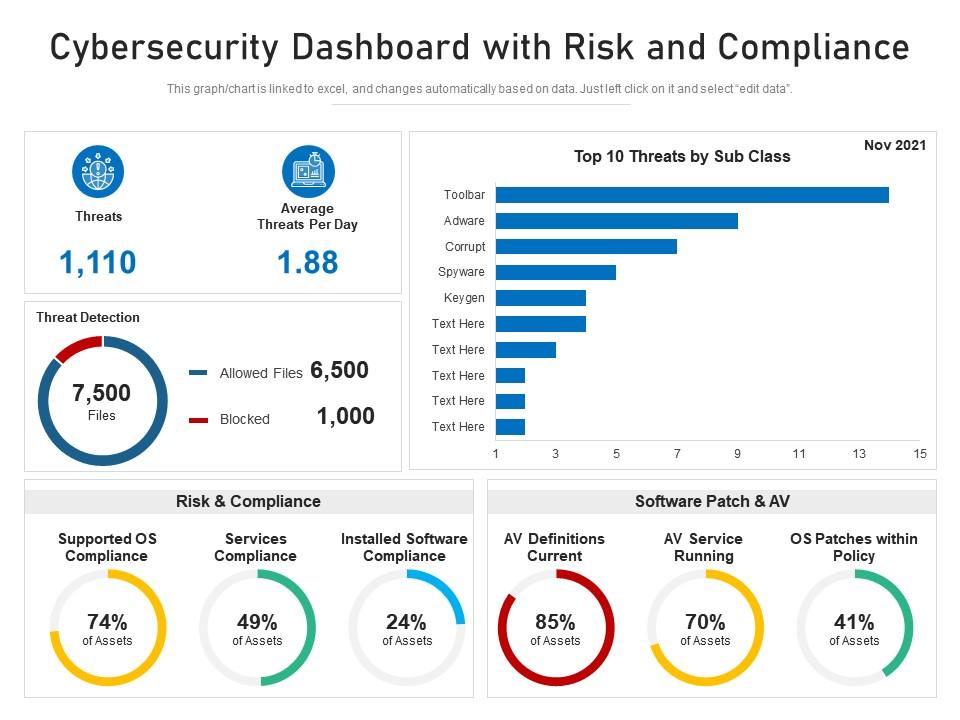
Cybersecurity assists in protecting your organization's reputation and brand image by restricting data breaches and other security incidents that can erode customer trust and confidence. This IT dashboard doesn’t only present metrics relating to cybersecurity but also incorporates risk and compliance metrics for a comprehensive overview. Some metrics displayed by this dashboard include average threats by day, percentage of services compliance, and top 10 threats by sub class.
Metabase IT Compliance
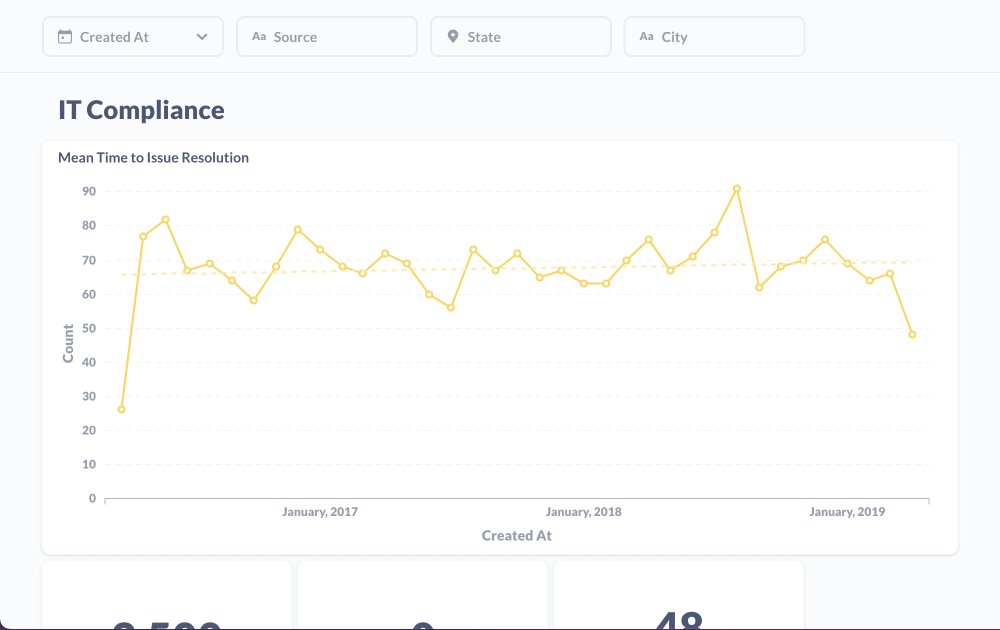
By tracking compliance effectively, organizations can alleviate risks, improve trust and confidence among stakeholders, and maintain regulatory compliance in an increasingly complex and dynamic business environment. This means utilzing an effective IT compliance dashboard, like this example by Metabase, can help to streamline your organizations compliance operations. This IT dashboard examples present metrics such as mean time to issue resolution, dwell time, and predicted vs actual risks.
Geckoboard IT Team
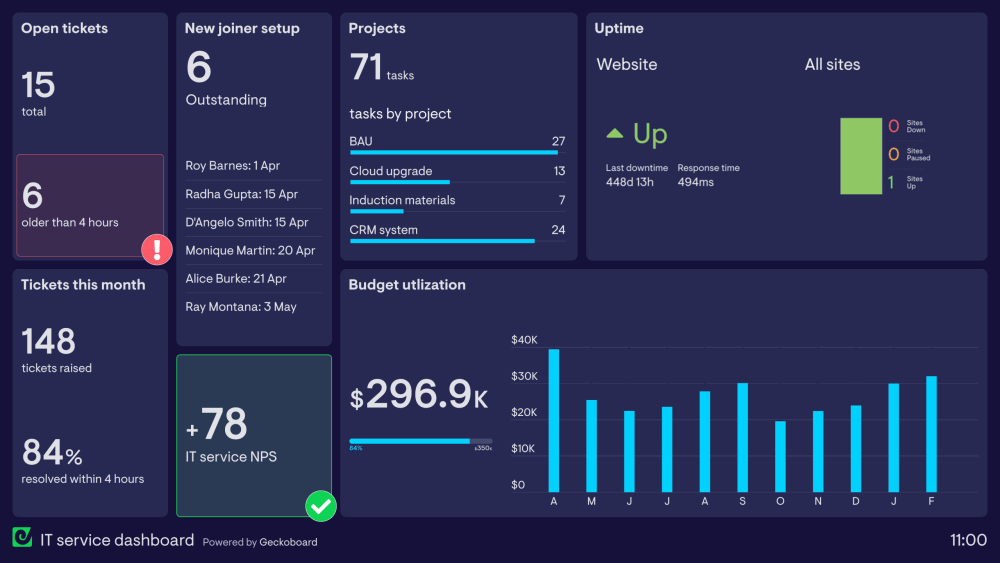
The final IT dashboard example in our list is an overview of various metrics related to an IT teams daily operations, goals, and responsibilities. The dashboard is useful for IT teams as it can be used as a point of reference multiple times throughout the day to help ensure the teams activities are moving in the right direction. With this dashboard you can view numerous metrics such as uptime, projects, and tickets this month.
If you've enjoyed this article why not learn How to Build Dashboards or read our article on The Top 15 New Relic Dashboard Examples next?