
Getting Started, How To Guides
5 min read
Last updated:
Index patterns are essential when querying Elasticsearch with Kibana, as they provide a structured way to access and interact with your data. By defining an index pattern, you can map how Kibana should retrieve and display the data stored in Elasticsearch. This simplifies querying by allowing you to search across multiple indices at once, making it easier to analyze large and complex datasets. Index patterns also enable features like data filtering, aggregation, and visualization, helping you gain insights quickly and efficiently. Using index patterns is crucial for organizing your data, ensuring seamless exploration and better decision-making in Kibana. Discover how using index patterns can help you to query Elasticsearch with Kibana in this brief guide.
Contents
All logs and metrics that you send to Logit.io belong to an index pattern. To search your data with Kibana you have to select which Elasticsearch index or indices that you want to explore. You can do this in Kibana by configuring index patterns.
An index pattern is a string with optional wildcards. The index pattern can match the name of a single index or include wildcards (*) to match multiple indices.
All new Logit.io stacks come pre-configured with a number of useful index patterns to help you get started. To get started with using Logit.io simply sign up to our platform and experience 14-days of free access to create stacks backed by ELK, Grafana or Open Distro for Elasticsearch (ODFE). Also with OpenTelemetry (OTel) and Logit.io, you can gain end-to-end observability effortlessly. Essentially, OpenTelemetry standardizes all data from any source, enabling automated analysis and as a result, saving your engineers hours every month.
After your trial period ends you can choose from a range of cost-efficient pricing plans that are most suitable for their requirements with overage protection being included as standard across all plans.
Some of the leading benefits of using Logit.io for ELK Stack hosting include:
- Fully open platform backed by the best solutions in open source, such as Grafana, OpenSearch, and Jaeger
- Highly available data centres in EU, UK and US regions
- Approved by GOV.UK as a Platform As A Service (PaaS)
- Enterprise uptime SLAs available to 99.999%
- Two factor authentication (2FA)
- Fully managed upgrade paths
- Easy to understand billing
- Overusage protection
- No data egress fees
- No vendor lock-in
- Hundreds of integrations
Unlock complete visibility with hosted ELK, Grafana, and Prometheus-backed Observability
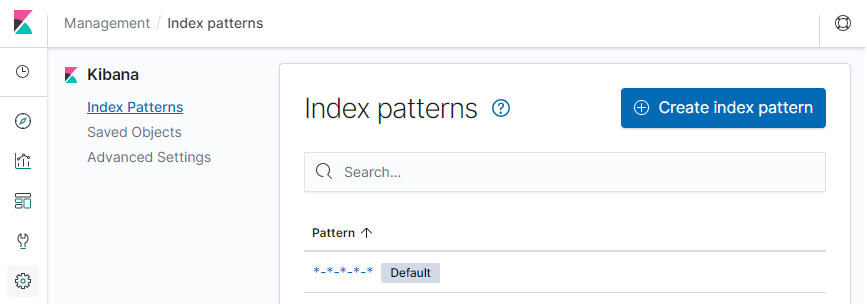
Start Free TrialOnce you have signed up and have selected "launch Kibana" from your provisioning dashboard, you will need to complete the following steps to view your index patterns:
- Select "Management" from the left navigation
- Choose "Index Patterns"
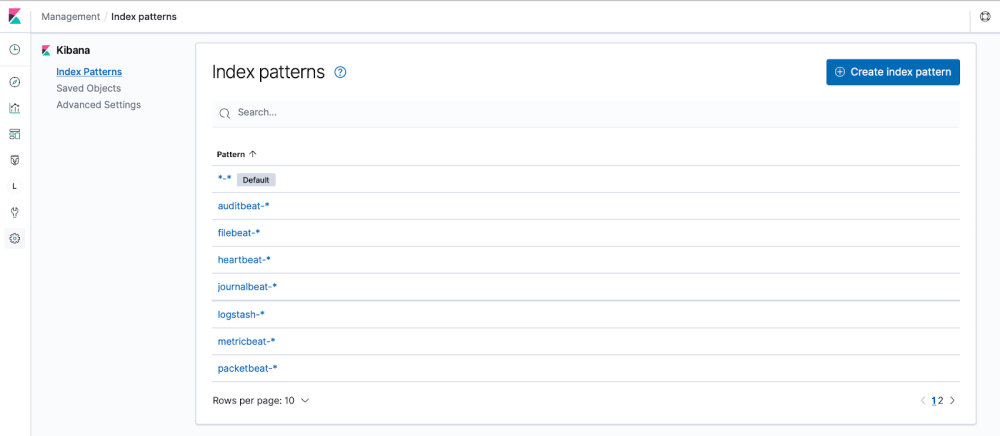
All new Logit.io ELK stacks provide you with default indexes, including:
- - Default
- filebeat-*
- logstash-*
- auditbeat-*
- metricbeat-*
- heartbeat-*
- packetbeat-*
The filebeat-* index pattern enables you to search all fields for any logs sent to Logit.io using the Filebeat shipper, this is an example of an index pattern matching on a single index.
Tip: When you access Kibana for the very first time the default index pattern is set to search log data from all indices being sent to Elasticsearch (a multiple indices match), the pattern is *-*.
How To Create an Index
The "Create Index Pattern" button is found above the list of existing index patterns as shown below:
Select this and Kibana will display the list of indices for which logs are available. You will see that the "Next Step" button is disabled and will only become available when the specified index name that you have entered matches any indices.
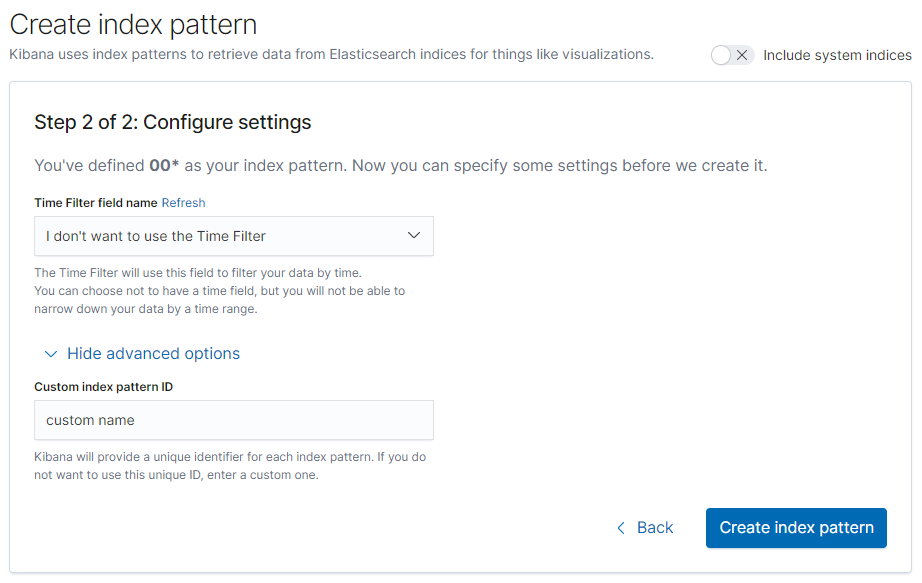
When you are setting up a new index pattern, if your index contains one or more timestamp fields you will be asked to select one. This is the field that will be used to filter your data by time. If you do not wish to filter your search by timestamp you can select the "I don't want to use the Time Filter" option.
Tip: You can give fields a timestamp during mapping by using Index Templates, read more about Index Templates and Mappings.
How To Set A Default Index Pattern
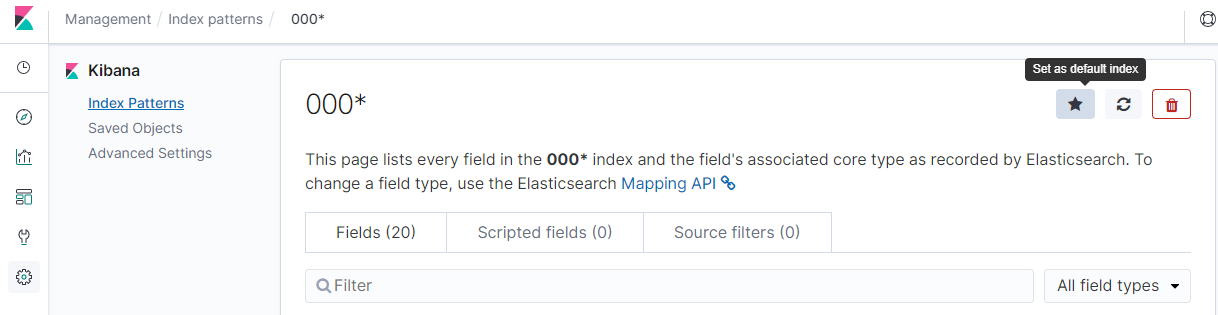
If you want the new index pattern to be designated as your default pattern to load whenever you select the "Discover" tab then click the favourite star button after the index has finished being created. This is located in the top right-hand side of the screen.
How To Refresh Index Patterns
If you add any further index mapping, Kibana automatically scans the indices that match each pattern to display a list of the new fields. It does not however, automatically pick them up.
You can refresh the index pattern to pick up any newly-added fields by selecting the index pattern and then clicking the "refresh" icon in the top right-hand side of the screen.
When refreshing you will be prompted to reset the popularity counters for each field. Kibana keeps track of the fields that you've used the most often and the place where this data is stored is called a popularity counter. The data is used to sort fields within lists, by refreshing the index pattern this data and ability to sort will be reset.
How To Delete An Index Pattern
To delete an index pattern, select the index from the Index Patterns page and then click the "delete" icon in the top right-hand side of the screen (next to the default and refresh icons previously mentioned).
You can recreate an index pattern again at any time in the future but you will also lose all visualisations, saved searches, and other saved objects that reference the pattern as well as all data in any popularity counters, so be careful!
In the event that you need any help with configuring Kibana index patterns, our support team are always on hand to help, simply reach out to us via live chat and we'll be able to help answer any of your questions and help you get started.
If you want to continue learning more about Kibana then why not review this helpful Kibana query language cheat sheet that covers most of the common queries you’ll encounter on your analysis journey.
If you enjoyed this guide on using index patterns to search logs and metrics with Kibana then why not check out our article on Github vs Gitlab.