Getting started with Grafana Dashboards
Grafana dashboards are powerful, customizable visual interfaces designed to help users monitor, analyze, and interpret data from various sources. As part of the open-source Grafana platform, these dashboards allow organizations to consolidate metrics and logs into a unified view, providing real-time insights and historical trends.
What Is Grafana Dashboards?
At their core, Grafana dashboards are composed of panels, each representing a specific type of visualization such as graphs, tables, heatmaps, or gauges. Users can tailor these panels to display key performance indicators (KPIs), system health, or application metrics, drawing data from diverse sources like Prometheus, Elasticsearch, InfluxDB, or cloud platforms.
Why Use Grafana Dashboards?
What sets Grafana dashboards apart is their flexibility and user-centric design. They empower teams to create dynamic and interactive views, enabling deeper exploration of data through filters, drilldowns, and alerts. Whether you’re troubleshooting infrastructure issues, monitoring application performance, or visualizing business metrics, Grafana dashboards serve as a cornerstone for data-driven decision-making.
Using Grafana Dashboards with Logit.io
To use Grafana Dashboards with Logit.io you need to create an Infrastructure Metrics stack or Log Management stack and send some data. Logit.io provides Grafana Dashboards as part of the Metrics Infrastructure stack and can be added as an extra to the Log Management stack for visualizing your metrics and logs.
To learn more about how to create an Infrastructure Metrics stack click here
To learn more about how to send metric data to your stack click here
To learn more about how to create a Log Management stack click here
To learn more about how to send log data to your stack click here
Once you have created your stack and sent data, you can launch the Grafana Dashboards visualizer to view your stack's data. If you have an Infrastructure Metrics stack, you do
this by pressing the Launch Metrics button found at the top of your Logit.io stack or on the stack settings page:

If you have a Log Management stack, you do this by clicking on the Launch Grafana button of your stack on the dashboard.

Logit.io provides custom dashboards that are ready for you to use. You can also create your own dashboards.
How to create a Grafana Dashboard
Dashboards are collections of visualizations (panels). Click here to read more about them and how they are created.
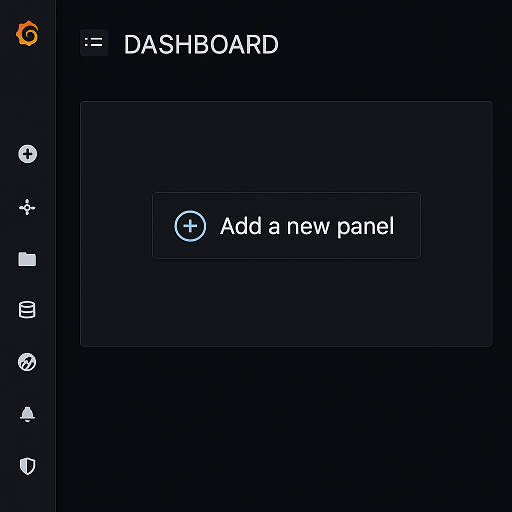
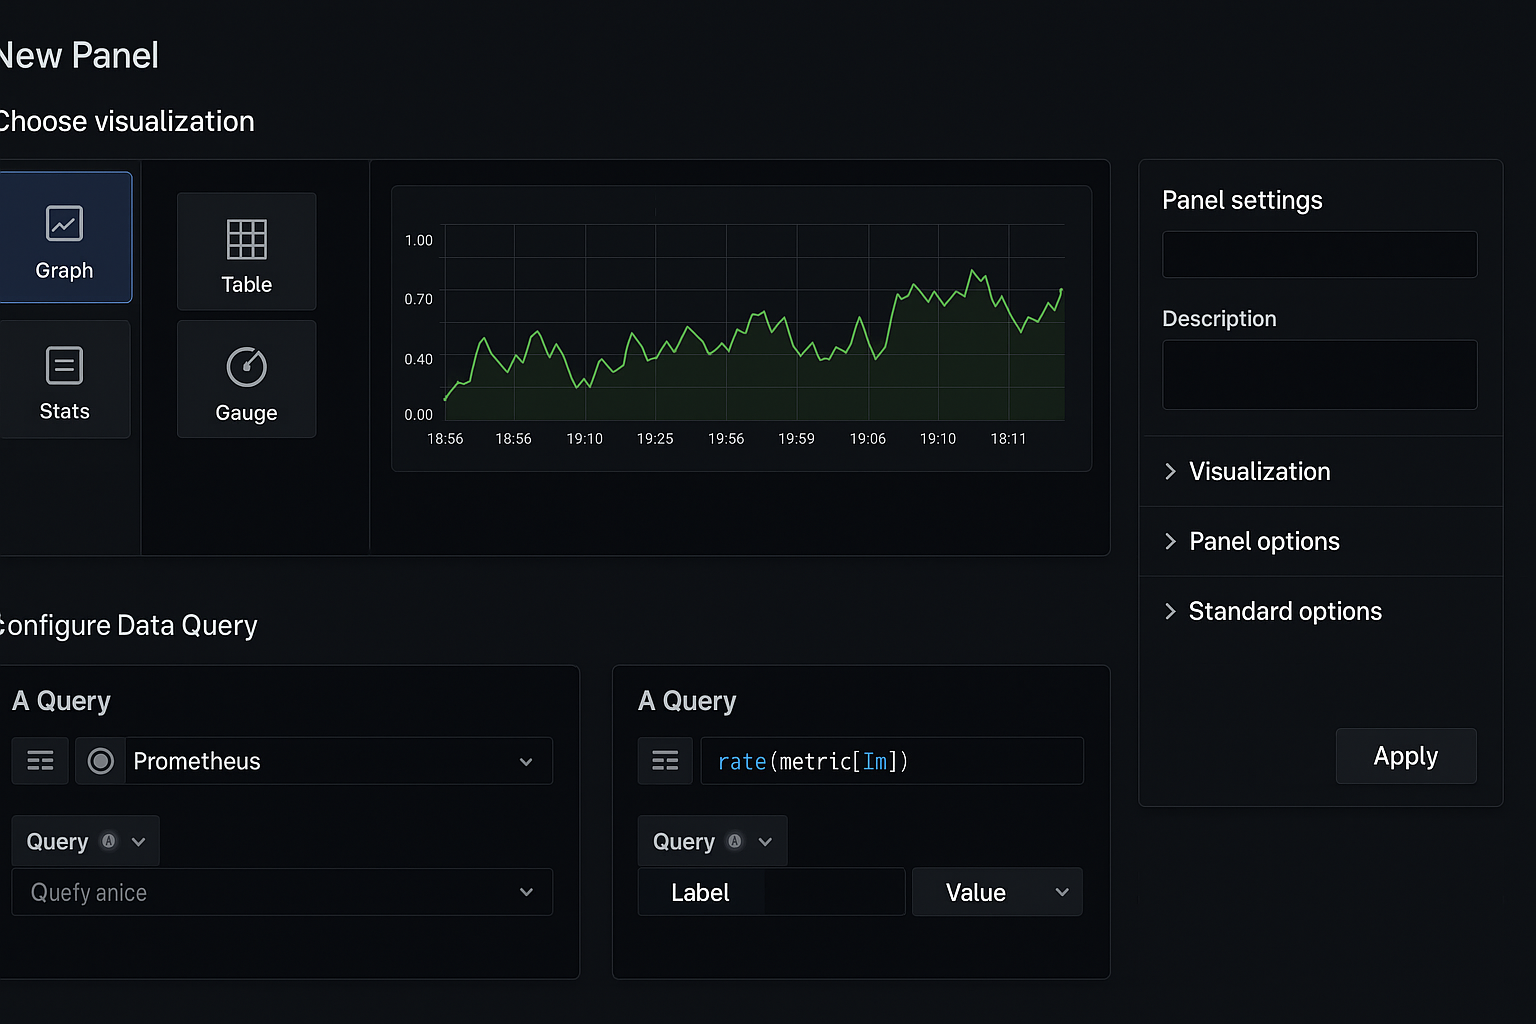
Panels are the building blocks of a dashboard:
Choose Visualization Type - Select from graphs, tables, gauges, heatmaps, and more.
Configure Data Query - Define how data should be fetched from your data source.
Use Grafana’s query builder for basic queries.
Use the query editor for advanced configurations.
Customize Panel Settings - Adjust titles, labels, thresholds, and colors for better readability.
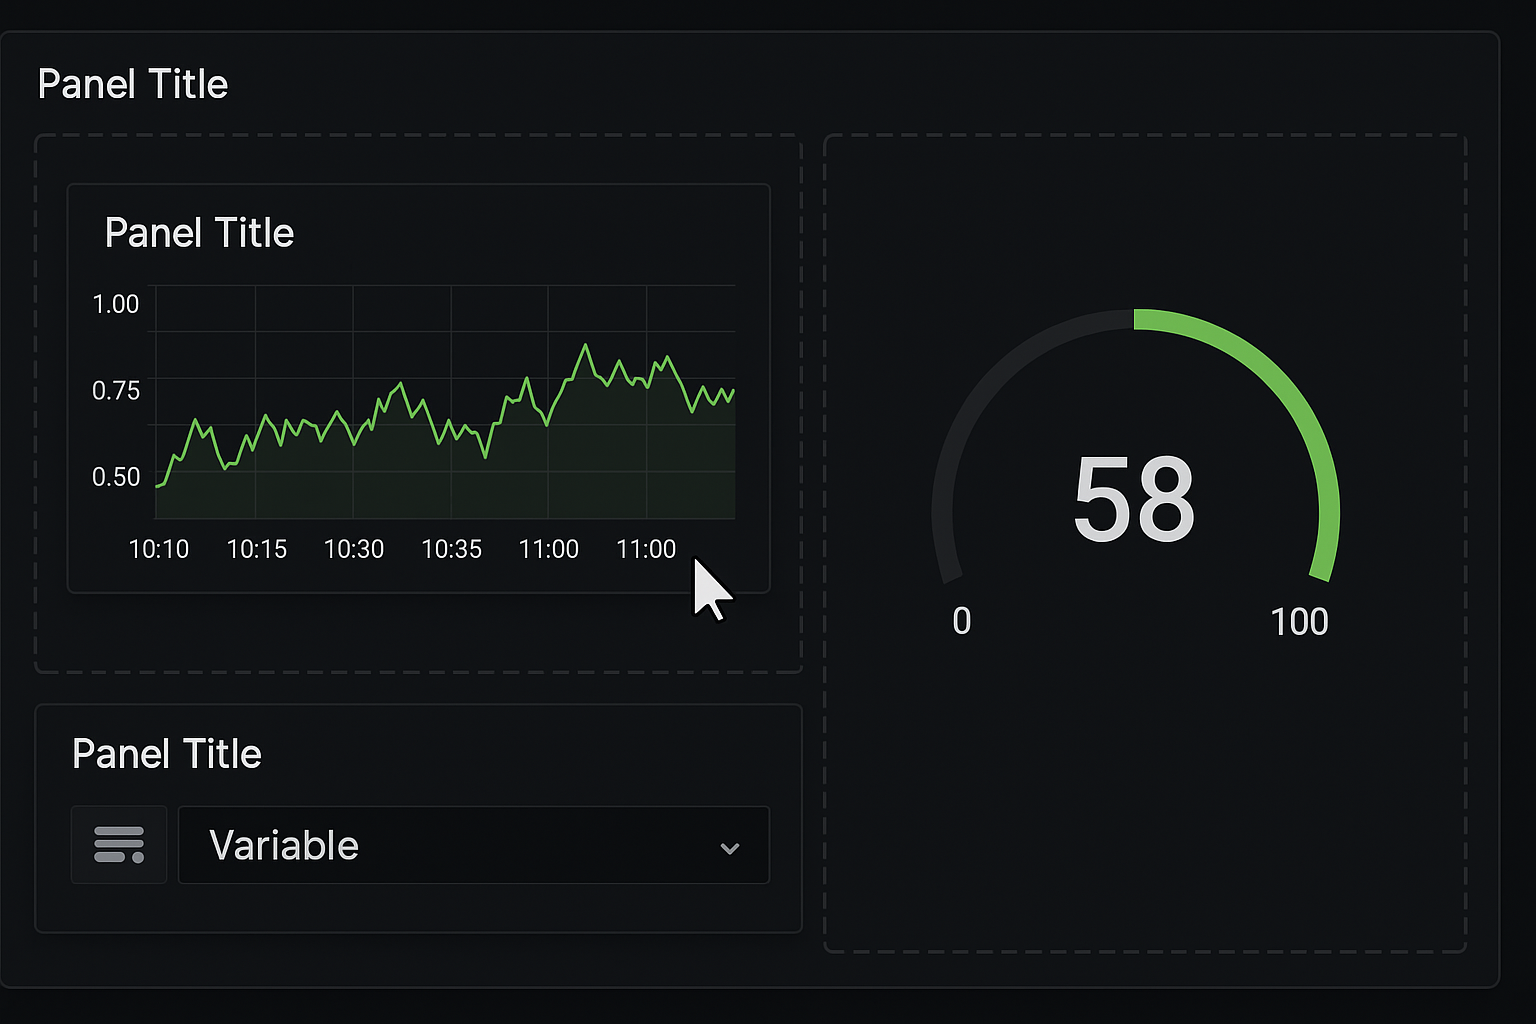
Working with your Grafana Dashboard
After you have saved your new visualization you can then organise and customize, here are examples of some of the things you may want to do:
Resize and Rearrange Panels - Drag and drop panels to arrange them as needed.
__Add Variables: Create variables (such as time ranges or filters) to make your dashboard dynamic and interactive.
Set Themes - Use the dashboard settings to switch between light and dark themes.
Set Up Alerts
Alerts notify you of critical conditions in your data. Grafana’s alerts, integrated with notification channels like email, Slack, or PagerDuty, enable real-time incident response, ensuring operational continuity and minimizing downtime.
Setting up alerts in Grafana dashboards is crucial for proactive monitoring and immediate response to critical conditions. Here are some examples of where alerts are highly beneficial:
Monitoring System Performance - Alert when CPU or memory usage exceeds a certain threshold, indicating potential resource exhaustion, or trigger alerts if available disk space drops below a critical level to prevent data loss or system failure.
Application Health - Alert when the error rate in an application increases, signaling potential bugs or degraded performance. Notify when API or service response times exceed acceptable levels, impacting user experience. Detect and alert if an application or service becomes unavailable.
Infrastructure Stability - Monitor server availability and send alerts for unexpected reboots or crashes. Trigger alerts if network latency surpasses a predefined limit, indicating connectivity issues. Notify when query times exceed expectations, or when database locks persist.
Security - Alert on a surge in failed login attempts, signaling a potential brute-force attack or notify when specific endpoints or sensitive data are accessed unexpectedly.
Business Metrics - Trigger alerts when sales or revenue decline significantly below expected levels or notify when user activity metrics (e.g., sign-ups or page views) deviate sharply from norms.
Log Analysis - Alert on specific error messages or patterns appearing in logs or notify when unusual log patterns or spikes occur, indicating abnormal system behavior. To create alerts, open a panel and click Edit. Navigate to the Alert tab and then configure alert conditions, evaluation frequency, and notification channels (e.g., email, Slack).
Summary
Grafana dashboards are customizable visual interfaces that consolidate and display metrics and logs from various data sources. They are composed of panels, each visualizing data as graphs, tables, gauges, or other formats. Designed for real-time monitoring and analysis, Grafana dashboards are highly interactive, allowing users to filter, explore, and customize data views. They also support alerts, enabling proactive responses to critical conditions. With their flexibility and integrative capabilities, Grafana dashboards empower teams to make data-driven decisions effectively. To find out more about using Grafana Dashboards with Logit.io, you can click here for more information.