Debian
Ship system log files from Debian to Logstash
Follow the steps below to send your observability data to Logit.io
Logs
Configure Filebeat to ship logs from Debian Systems to Logstash and Elasticsearch.
Install Integration
Install Filebeat
To get started you will need to install filebeat. To do this you have two main options:
- Choose the AMD / Intel file (x86_64) or
- Choose the ARM file (aarch64)
You can tell if you have a PC with an ARM CPU architecture by opening the Terminal
application and running the arch command. If it displays arm64 you have ARM architecture.
To successfully install filebeat you will need to have root access.
If you have an x86_64 system download and install filebeat using the following commands:
curl -L -O https://artifacts.elastic.co/downloads/beats/filebeat/filebeat-8.15.2-amd64.deb
sudo dpkg -i filebeat-8.15.2-amd64.deb
If you have an aarch64 system download and install filebeat using the following commands:
curl -L -O https://artifacts.elastic.co/downloads/beats/filebeat/filebeat-8.15.2-arm64.deb
sudo dpkg -i filebeat-8.15.2-arm64.deb
The default configuration file is located at:
/etc/filebeat/filebeat.yml
Enable The System Module
There are several built in filebeat modules you can use. You will need to enable the system module.
Change directory to the location where filebeat was extracted and run the following commands:
sudo filebeat modules list
sudo filebeat modules enable system
Navigate to the modules.d folder, copy the snippet below and replace the contents of the system.yml module file:
# Module: system
# Docs: https://www.elastic.co/guide/en/beats/filebeat/8.15.2/filebeat-module-system.html

- module: system
  # Syslog
  syslog:
    enabled: true

    # Set custom paths for the log files. If left empty,
    # Filebeat will choose the paths depending on your OS.
    #var.paths:

  # Authorization logs
  auth:
    enabled: true

    # Set custom paths for the log files. If left empty,
    # Filebeat will choose the paths depending on your OS.
    #var.paths:
Update Your Configuration File
The configuration file below is pre-configured to send data to your Logit.io Stack via Logstash.
Note: Please make sure the 'hosts' field in the Logstash outputs section is correctly populated. If you are logged into your Logit.io account the 'hosts' field should have been pre-populated with the correct values.
Copy the configuration file below (making the above changes as necessary) and overwrite the contents of filebeat.yml (this file can be found in the location where you installed Filebeat in the previous step).
####################### Logit.io Filebeat Configuration ########################
# ============================== Filebeat inputs ==============================
filebeat.inputs:
- type: journald
  id: journald

# ============================== Filebeat modules ==============================
filebeat.config.modules:
  path: ${path.config}/modules.d/*.yml
  reload.enabled: false
  #reload.period: 10s

# ================================= Processors =================================
processors:
  - add_host_metadata:
      when.not.contains.tags: forwarded
  - add_cloud_metadata: ~
  - add_docker_metadata: ~
  - add_kubernetes_metadata: ~

# ================================== Outputs ===================================
# ------------------------------ Logstash Output -------------------------------
output.logstash:
  hosts: ["@logstash.host:@logstash.sslPort"]
  loadbalance: true
  ssl.enabled: true
Validate Configuration
sudo @beatname test config -c /etc/@beatname/@beatname.ymlIf the yml file is invalid, @beatname will print a description of the error. For example, if the
output.logstash section was missing, @beatname would print no outputs are defined, please define one under the output section
Start filebeat
To start Filebeat, run:
sudo systemctl start filebeatLaunch OpenSearch Dashboards to View Your Data
Launch OpenSearch DashboardsHow to diagnose no data in Stack
If you don't see data appearing in your stack after following this integration, take a look at the troubleshooting guide for steps to diagnose and resolve the problem or contact our support team and we'll be happy to assist.
(Optional) Update Logstash Pipelines
All Logit.io stacks come pre-configured with popular Logstash Pipelines. We would recommend that you add system specific filters if you don't already have them, to ensure enhanced dashboards and modules work correctly.
Edit PipelinesEdit your Logstash Pipelines by choosing Stack > Settings > Logstash Pipelines.
if [fileset][module] == "system" {
  if [fileset][name] == "auth" {
    grok {
      match => { "message" => ["%{SYSLOGTIMESTAMP:[system][auth][timestamp]} %{SYSLOGHOST:[system][auth][hostname]} sshd(?:\[%{POSINT:[system][auth][pid]}\])?: %{DATA:[system][auth][ssh][event]} %{DATA:[system][auth][ssh][method]} for (invalid user )?%{DATA:[system][auth][user]} from %{IPORHOST:[system][auth][ssh][ip]} port %{NUMBER:[system][auth][ssh][port]} ssh2(: %{GREEDYDATA:[system][auth][ssh][signature]})?",
                "%{SYSLOGTIMESTAMP:[system][auth][timestamp]} %{SYSLOGHOST:[system][auth][hostname]} sshd(?:\[%{POSINT:[system][auth][pid]}\])?: %{DATA:[system][auth][ssh][event]} user %{DATA:[system][auth][user]} from %{IPORHOST:[system][auth][ssh][ip]}",
                "%{SYSLOGTIMESTAMP:[system][auth][timestamp]} %{SYSLOGHOST:[system][auth][hostname]} sshd(?:\[%{POSINT:[system][auth][pid]}\])?: Did not receive identification string from %{IPORHOST:[system][auth][ssh][dropped_ip]}",
                "%{SYSLOGTIMESTAMP:[system][auth][timestamp]} %{SYSLOGHOST:[system][auth][hostname]} sudo(?:\[%{POSINT:[system][auth][pid]}\])?: \s*%{DATA:[system][auth][user]} :( %{DATA:[system][auth][sudo][error]} ;)? TTY=%{DATA:[system][auth][sudo][tty]} ; PWD=%{DATA:[system][auth][sudo][pwd]} ; USER=%{DATA:[system][auth][sudo][user]} ; COMMAND=%{GREEDYDATA:[system][auth][sudo][command]}",
                "%{SYSLOGTIMESTAMP:[system][auth][timestamp]} %{SYSLOGHOST:[system][auth][hostname]} groupadd(?:\[%{POSINT:[system][auth][pid]}\])?: new group: name=%{DATA:system.auth.groupadd.name}, GID=%{NUMBER:system.auth.groupadd.gid}",
                "%{SYSLOGTIMESTAMP:[system][auth][timestamp]} %{SYSLOGHOST:[system][auth][hostname]} useradd(?:\[%{POSINT:[system][auth][pid]}\])?: new user: name=%{DATA:[system][auth][user][add][name]}, UID=%{NUMBER:[system][auth][user][add][uid]}, GID=%{NUMBER:[system][auth][user][add][gid]}, home=%{DATA:[system][auth][user][add][home]}, shell=%{DATA:[system][auth][user][add][shell]}$",
                "%{SYSLOGTIMESTAMP:[system][auth][timestamp]} %{SYSLOGHOST:[system][auth][hostname]} %{DATA:[system][auth][program]}(?:\[%{POSINT:[system][auth][pid]}\])?: %{GREEDYMULTILINE:[system][auth][message]}"] }
      pattern_definitions => {
        "GREEDYMULTILINE"=> "(.|\n)*"
      }
      remove_field => "message"
    }
    date {
      match => [ "[system][auth][timestamp]", "MMM  d HH:mm:ss", "MMM dd HH:mm:ss" ]
    }
    geoip {
      source => "[system][auth][ssh][ip]"
      target => "[system][auth][ssh][geoip]"
    }
  }
  else if [fileset][name] == "syslog" {
    grok {
      match => { "message" => ["%{SYSLOGTIMESTAMP:[system][syslog][timestamp]} %{SYSLOGHOST:[system][syslog][hostname]} %{DATA:[system][syslog][program]}(?:\[%{POSINT:[system][syslog][pid]}\])?: %{GREEDYMULTILINE:[system][syslog][message]}"] }
      pattern_definitions => { "GREEDYMULTILINE" => "(.|\n)*" }
      remove_field => "message"
    }
    date {
      match => [ "[system][syslog][timestamp]", "MMM  d HH:mm:ss", "MMM dd HH:mm:ss" ]
    }
  }
}
Metrics
Configure Telegraf to ship your system metrics to Logit.io.
Install Integration
Install Telegraf
This integration allows you to configure a Telegraf agent to send your metrics to Logit.io.
Choose the installation method for your operating system:
Debian and Ubuntu users can install the latest stable version of Telegraf using the apt package manager.
The command line below will:
- Download and install repository signing key
- Configure the influxdata repository
- Install telegraf
curl --silent --location -O \
https://repos.influxdata.com/influxdata-archive.key \
&& echo "943666881a1b8d9b849b74caebf02d3465d6beb716510d86a39f6c8e8dac7515  influxdata-archive.key" \
| sha256sum -c - && cat influxdata-archive.key \
| gpg --dearmor \
| sudo tee /etc/apt/trusted.gpg.d/influxdata-archive.gpg > /dev/null \
&& echo 'deb [signed-by=/etc/apt/trusted.gpg.d/influxdata-archive.gpg] https://repos.influxdata.com/debian stable main' \
| sudo tee /etc/apt/sources.list.d/influxdata.list
sudo apt-get update && sudo apt-get install telegraf
The default configuration file is location at:
/etc/telegraf/telegraf.conf
Configure the plugin
The configuration below will scrape a selection of system metrics from the machine you have installed Telegraf on and these will be sent to your Logit.io stack. Metrics include CPU, memory and disk usage and system metrics such as system load and uptime.
# Read metrics about cpu usage
[[inputs.cpu]]
  ## Whether to report per-cpu stats or not
  percpu = true
  ## Whether to report total system cpu stats or not
  totalcpu = true
  ## If true collect raw cpu time metrics
  collect_cpu_time = true
  ## If true compute and report the sum of all non-idle cpu states
  report_active = true

# Read metrics about memory usage
[[inputs.mem]]

# Read metrics about system load & uptime
[[inputs.system]]
  namepass = ["system"]

# Read metrics about disk usage by mount point
[[inputs.disk]]
  ## By default, telegraf gather stats for all mountpoints.
  ## Setting mountpoints will restrict the stats to the specified mountpoints.
  # mount_points = ["/"]

  ## Ignore some mountpoints by filesystem type. For example (dev)tmpfs (usually
  ## present on /run, /var/run, /dev/shm or /dev).
  ignore_fs = ["tmpfs", "devtmpfs"]

[[outputs.http]]
  url = "https://@metricsUsername:@metricsPassword@@metrics_id-vm.logit.io:@vmAgentPort/api/v1/write"
  data_format = "prometheusremotewrite"

  [outputs.http.headers]
    Content-Type = "application/x-protobuf"
    Content-Encoding = "snappy"
Start Telegraf
For systemd installations use systemctl to start telegraf
sudo systemctl start telegrafLaunch Metrics to View Data
Click the 'Launch Metrics' button below to open the infrastructure metrics visualizer.
Launch GrafanaNow, as a simple demonstration we will use Grafana to view some metrics data that is being sent to your Logit.io stack.
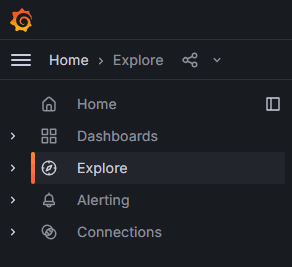
Once Grafana has been opened, click on the Explore option in the left-hand menu:
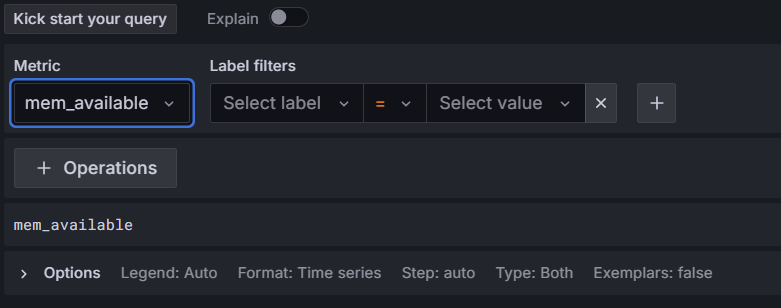
Under the Metric header you will see 'Select metric'. Open the drop-down menu and scroll to and select 'mem_available':
Click on the blue Run query button near the top-right of the screen:
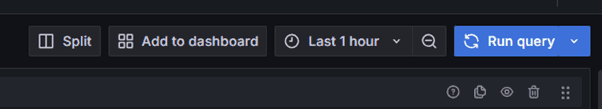
You will now see the metric data displayed and if you click on the blue Run query button this will be updated. You can set this to automatically update by clicking on the arrow on the blue button and choosing the interval at which you want the data to be updated.
When you want to stop Telegraf sending metric data press Ctrl + C in the terminal app / Powershell.
To learn more about Grafana Dashboard click here.