Getting started with Jaeger
Jaeger is an open-source distributed tracing system that helps monitor and troubleshoot distributed systems. By tracing requests as they flow through various services, Jaeger provides insights into system performance, identifies bottlenecks, and assists in debugging complex application interactions. It's an essential tool for Application Performance Monitoring (APM), particularly in systems with microservices, where traditional logging may not provide sufficient visibility into request flow across services.
In this guide, we'll explain what Jaeger does, why it's used, and how you can start using it for effective tracing and monitoring in your application with Logit.io.
What Does Jaeger Do?
Jaeger helps visualize the flow of requests through a distributed system by capturing distributed traces. Each trace represents a single request, a single interaction or transaction that flows through a distributed system, and is composed of spans, which are individual operations or events in the request lifecycle. Jaeger collects data about the following:
Latency: How long each operation or request took.
Dependencies: How services interact with each other.
Performance Bottlenecks: Identifying slow operations or services that may be affecting performance.
Error Detection: Monitoring and debugging errors by tracing the flow of requests.
By correlating this data, Jaeger allows you to visualize service performance, understand the timing of requests, and gain insights into service dependencies.
Why Use Jaeger?
Distributed Tracing: Jaeger traces requests as they pass through multiple services in a microservices architecture, helping you understand the request flow in complex environments.
Performance Monitoring: It identifies latency bottlenecks, allowing you to monitor the time taken by various operations and pinpoint performance issues.
Root Cause Analysis: Jaeger's traces allow you to debug failures and errors by following the path of a request, helping you identify which service or operation caused the issue.
Service Dependencies: Jaeger provides a visual map of how different services interact, which is especially valuable in distributed systems. You can see how services depend on each other and how failures in one service affect others.
Scalability: Jaeger is designed to scale horizontally and can handle large amounts of trace data, making it a reliable choice for production-grade observability.
If you're working with a microservices architecture, you could be facing challenges related to debugging and performance monitoring due to the distributed nature of the system. Jaeger helps address these issues by providing visibility into:
End-to-End Request Tracking: Track a request across its lifecycle, from frontend to backend, even when it crosses multiple services.
Service Performance Optimization: Identify and optimize high-latency operations or services that may be slowing down the overall system.
Improved Debugging: Quickly find the root cause of issues by following the trace of a request and checking for errors at any point in its journey.
Using Jaeger with Logit.io
To use Jaeger with Logit.io you need to create an Application Performance Monitoring (APM) stack and send some data. Logit.io provides the Jaeger visualizer as part of the APM stack for visualizing your distributed traces.
To learn more about how to do this click here (opens in a new tab)
Once you have created your stack and sent data you can launch the Jaeger visualizer to view your APM stack's data by pressing the Launch Traces button found at the top
of your Logit.io stack settings page:

Clicking Launch Traces will take you to your Jaeger instance.
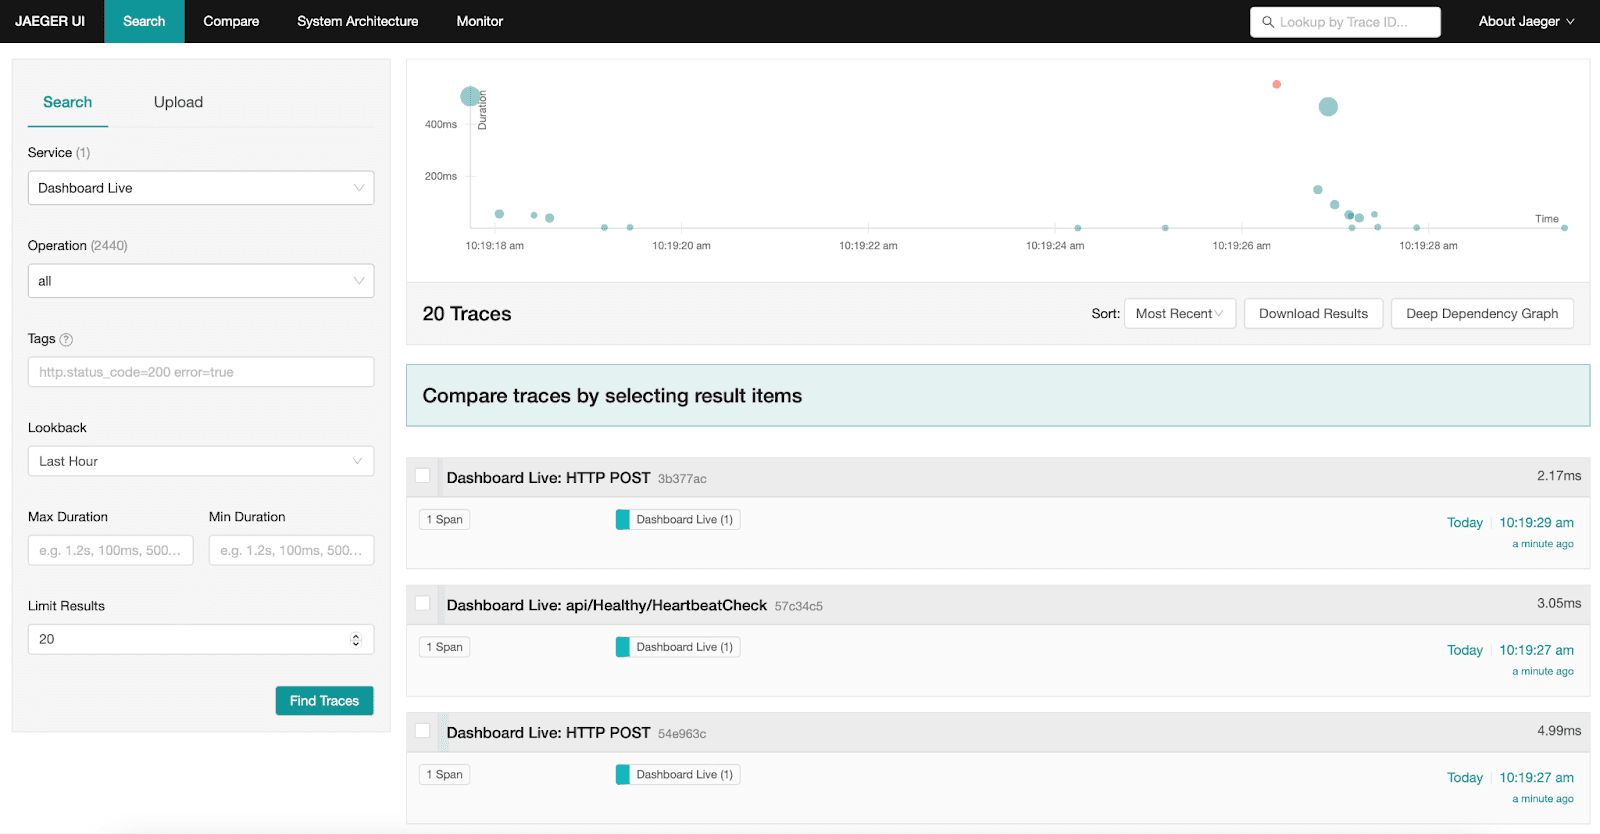
Now that you have traces appearing in the Jaeger UI, you can use the Jaeger UI to visualize and analyze them. Here's what you can do:
Search for Traces:
Select a service from the dropdown menu.
Set parameters like operation name, tags, and time range.
Click "Find Traces" to retrieve matching traces.
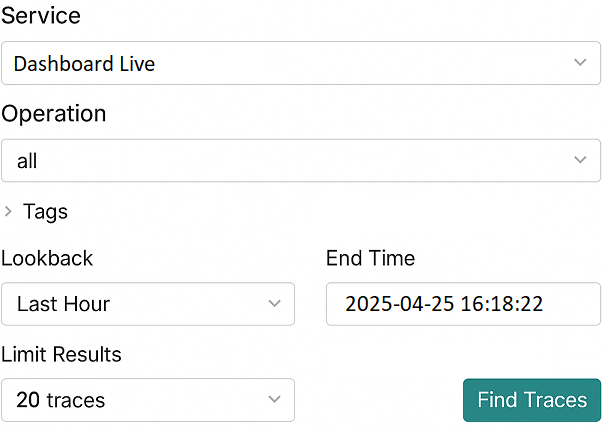
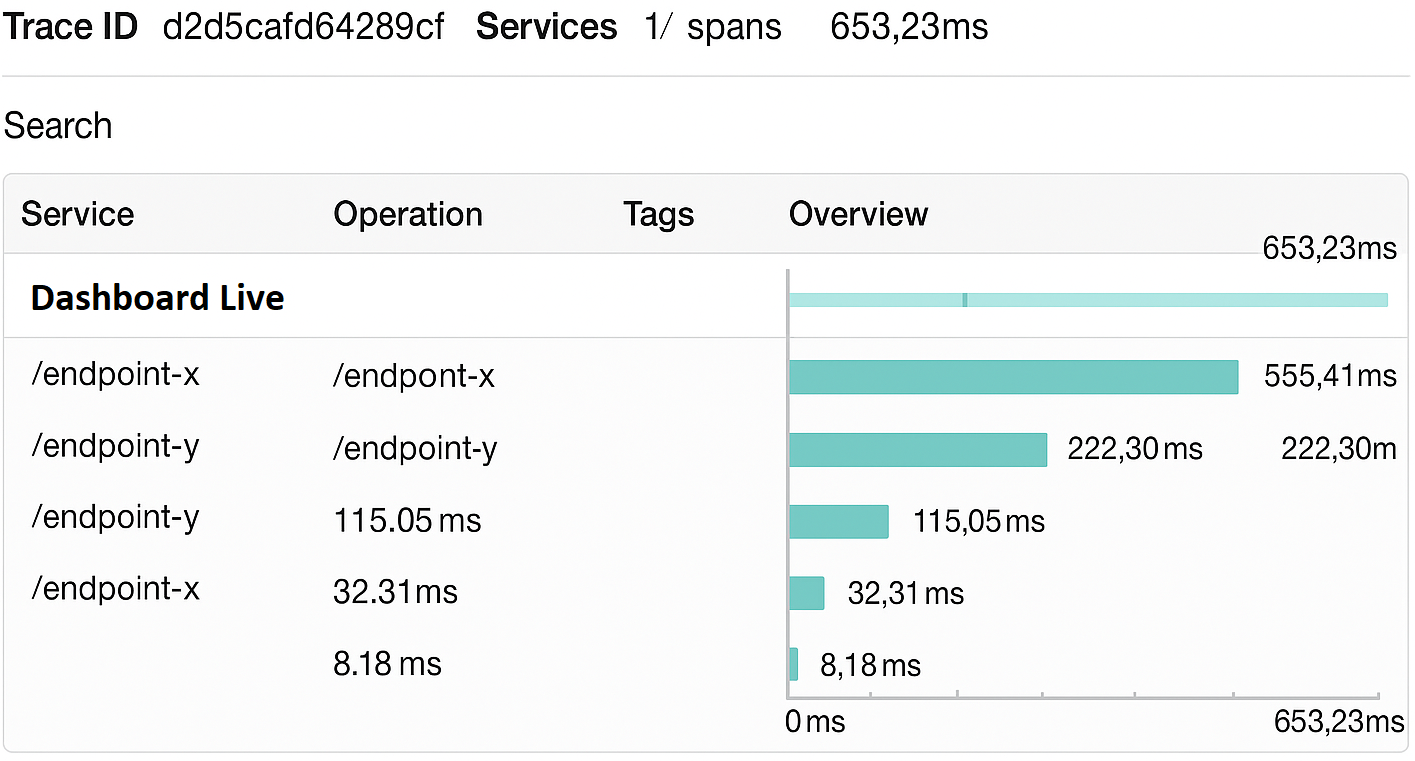
Trace Timeline View:
Clicking on a specific trace displays the sequence of spans (operations) in a trace and also shows the duration of each span, helping identify bottlenecks.
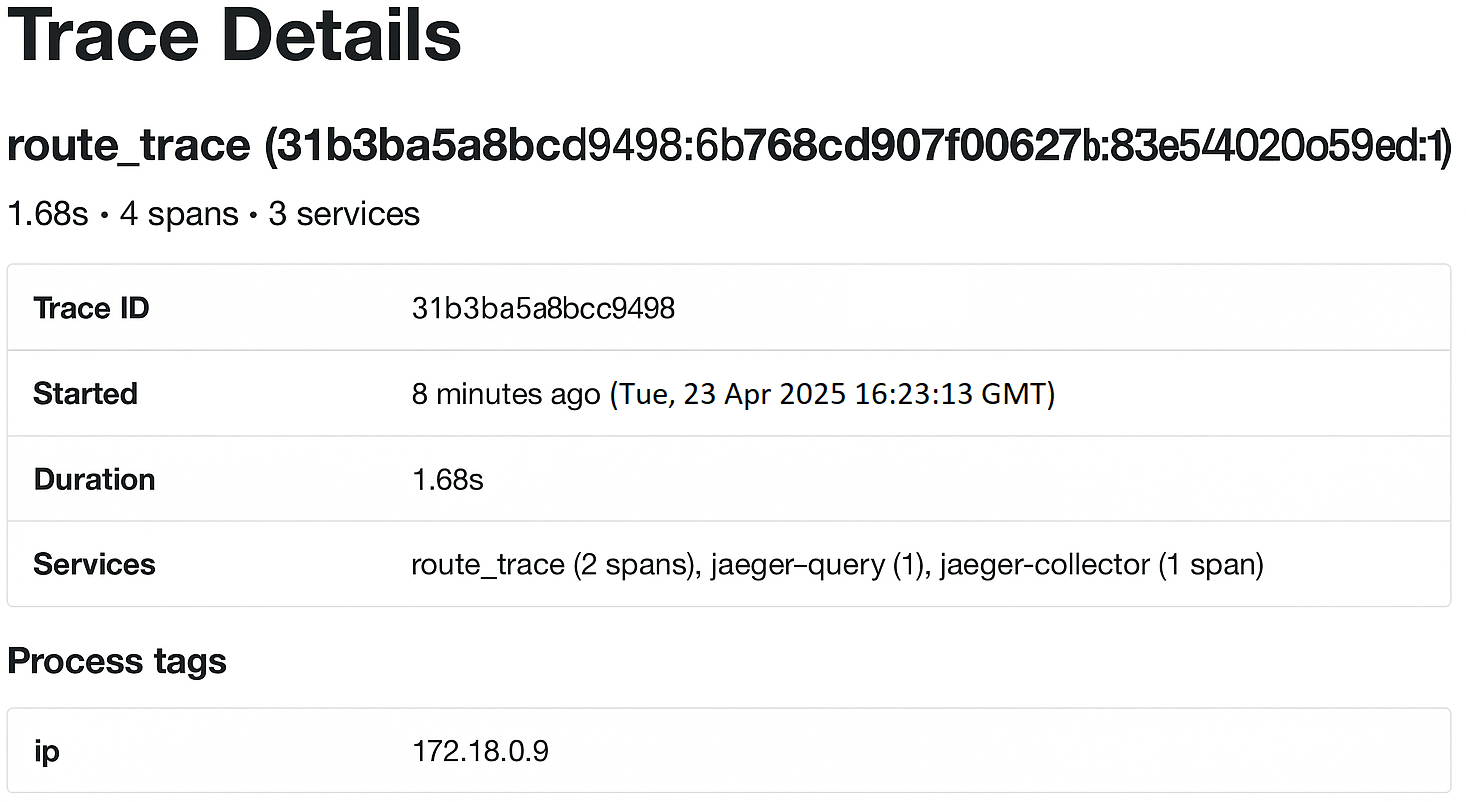
Trace Details:
Clicking on a span reveals detailed information, including logs, tags, and process data.
Service Dependencies:
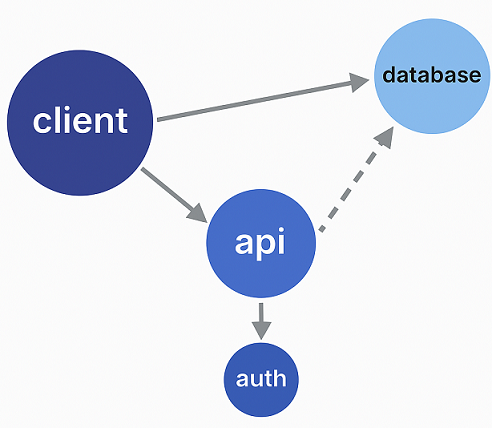
Clicking on Dependencies on the top navigation bar visualizes how services interact with each other, aiding in understanding system architecture.
Summary
Jaeger is a powerful tool for monitoring and debugging modern, distributed applications. By capturing and visualizing traces across distributed systems, it helps teams gain deep insights into request flows, pinpoint performance bottlenecks, and resolve issues faster.
When integrated with Logit.io, setting up Jaeger becomes a streamlined process, enabling you to launch a fully managed APM solution with just a few steps. From searching for traces and exploring detailed timelines to analyzing service dependencies, Jaeger empowers development and DevOps teams to understand and optimize their systems with confidence.