Getting started with OpenSearch Dashboards
OpenSearch Dashboards is an open-source data visualization and exploration tool designed to work with OpenSearch. It provides powerful real-time dashboards, charts, and analytics for your log data. Whether you're monitoring infrastructure, debugging applications, or tracking business metrics, OpenSearch Dashboards makes it easy to turn raw data into actionable insights.
What Is OpenSearch Dashboards?
OpenSearch Dashboards is the user interface for OpenSearch — the open-source fork of Elasticsearch and Kibana. It allows you to visualize and interact with your data stored in OpenSearch through interactive dashboards and visualizations (bar charts, pie charts, line graphs, tables, maps), full-text search and filtering, real-time log monitoring and alerting, anomaly detection, and observability features.
Why Use OpenSearch Dashboards?
OpenSearch Dashboards is ideal for companies, teams or users that want to:
Centralize observability data - Logs from multiple sources can be stored in OpenSearch and visualized in one place.
Monitor system health - Build dashboards that track infrastructure performance (CPU, memory, disk usage), application behavior, or uptime.
Troubleshoot faster - Filter and search through logs to quickly identify issues or anomalies.
Create shareable reports - Build and export custom dashboards for stakeholders or audit purposes.
Visualize business intelligence - Track KPIs and user behavior across applications.
Key Features:
Real-time data exploration and dashboards
Powerful search and filtering using OpenSearch Query DSL or Lucene
Multiple visualization types including charts, maps, and gauges
Alerting and notifications via OpenSearch plugins
Role-based access control (when integrated with OpenSearch security features)
Integration with Beats, Logstash, Fluentd, and many other data shippers
Using Opensearch Dashboards with Logit.io
To use Opensearch Dashboards with Logit.io you need to create a Log Management or Hosted OpenSearch stack and send some data. Logit.io provides the OpenSearch Dashboards as part of the Log Management stack and can be added as an extra to the Hosted OpenSearch stack for visualizing your distributed traces.
To learn more about how to create a Log Management stack click here
To learn more about how to create a Hosted OpenSearch stack click here
To learn more about how to send data to your stack click here
Once you have created your stack and sent data you can launch the OpenSearch Dashboards visualizer to view your stack's data by pressing the Launch Logs button found at
the top of your Logit.io stack or on the stack settings page:

This section of the article will explain some of the key features to help you get started with OpenSearch Dashboards. When the OpenSearch Dashboard visualizer opens, you will
see the Discovery view.
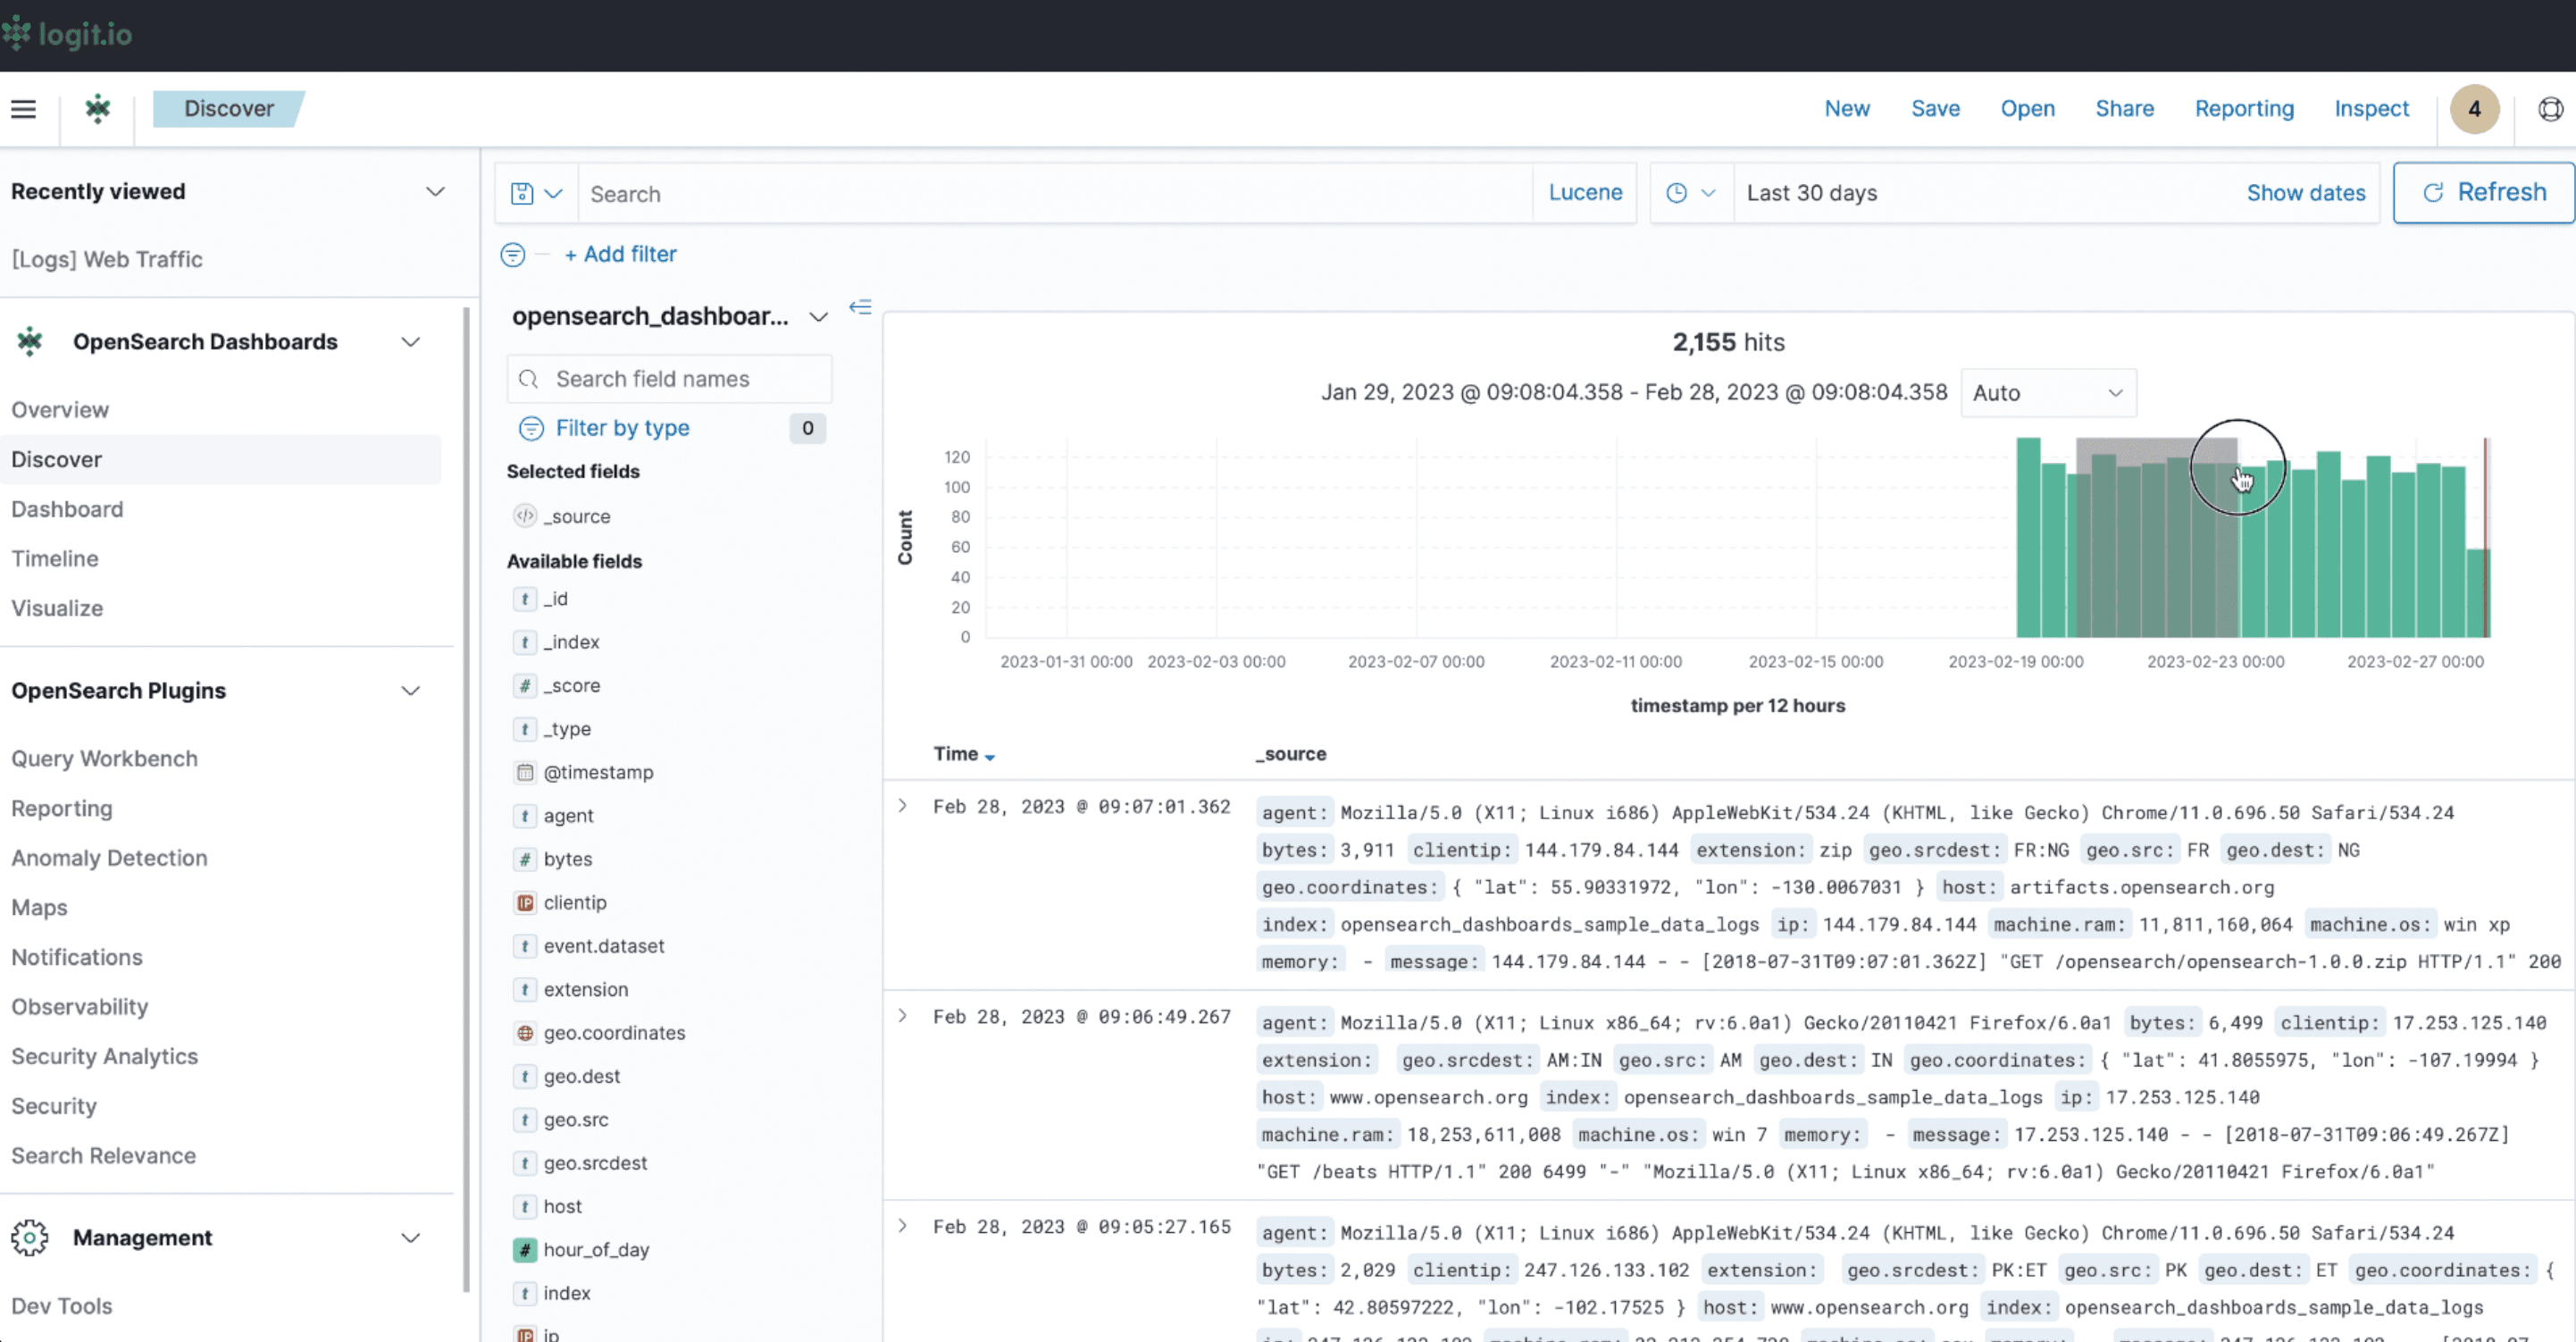
Discovery
Use Discover to explore raw logs and search through data. Here are examples of what you can do on the discovery page.
Search
You can use the Search bar at the top of the page to search for a word or expression.

The search bar in OpenSearch Dashboards is a powerful tool for querying and filtering your data. It allows users to refine displayed results by entering keywords, phrases, or complex query expressions using the Lucene, Elasticsearch Query DSL, or KQL (Kibana Query Language) syntax. This makes it easy to explore large datasets, pinpoint specific logs, metrics, or documents, and gain deeper insights into your data. You can combine the search bar with filters, field selections, and date ranges to create highly customized views for analysis or troubleshooting.
Here are some examples of how to use search:
A Basic search for 'payment failure' would search for all occurrences of "payment failure"
"payment failure"This search will return all documents containing the phrase "payment failure" in any field.
You can use a Field-Specific search, such as the error_type field.
error_type:"payment failure"This ensures that only logs with the exact phrase "payment failure" in the error_type field are displayed.
You can use a Boolean Search to combine multiple conditions using Boolean operators like AND, OR, and NOT.
error_type:"payment failure" AND status_code:500This query retrieves all documents where error_type is "payment failure" and the HTTP status_code is 500.
You can use a Wildcard Search to match partial terms.
error_type:pay* AND status_code:5*This finds logs where error_type starts with "pay" (e.g., "payment" or "payout") and status_code starts with "5" (e.g., 500, 503).
Selected Fields
You can choose a field to narrow a search by selecting a particular field.
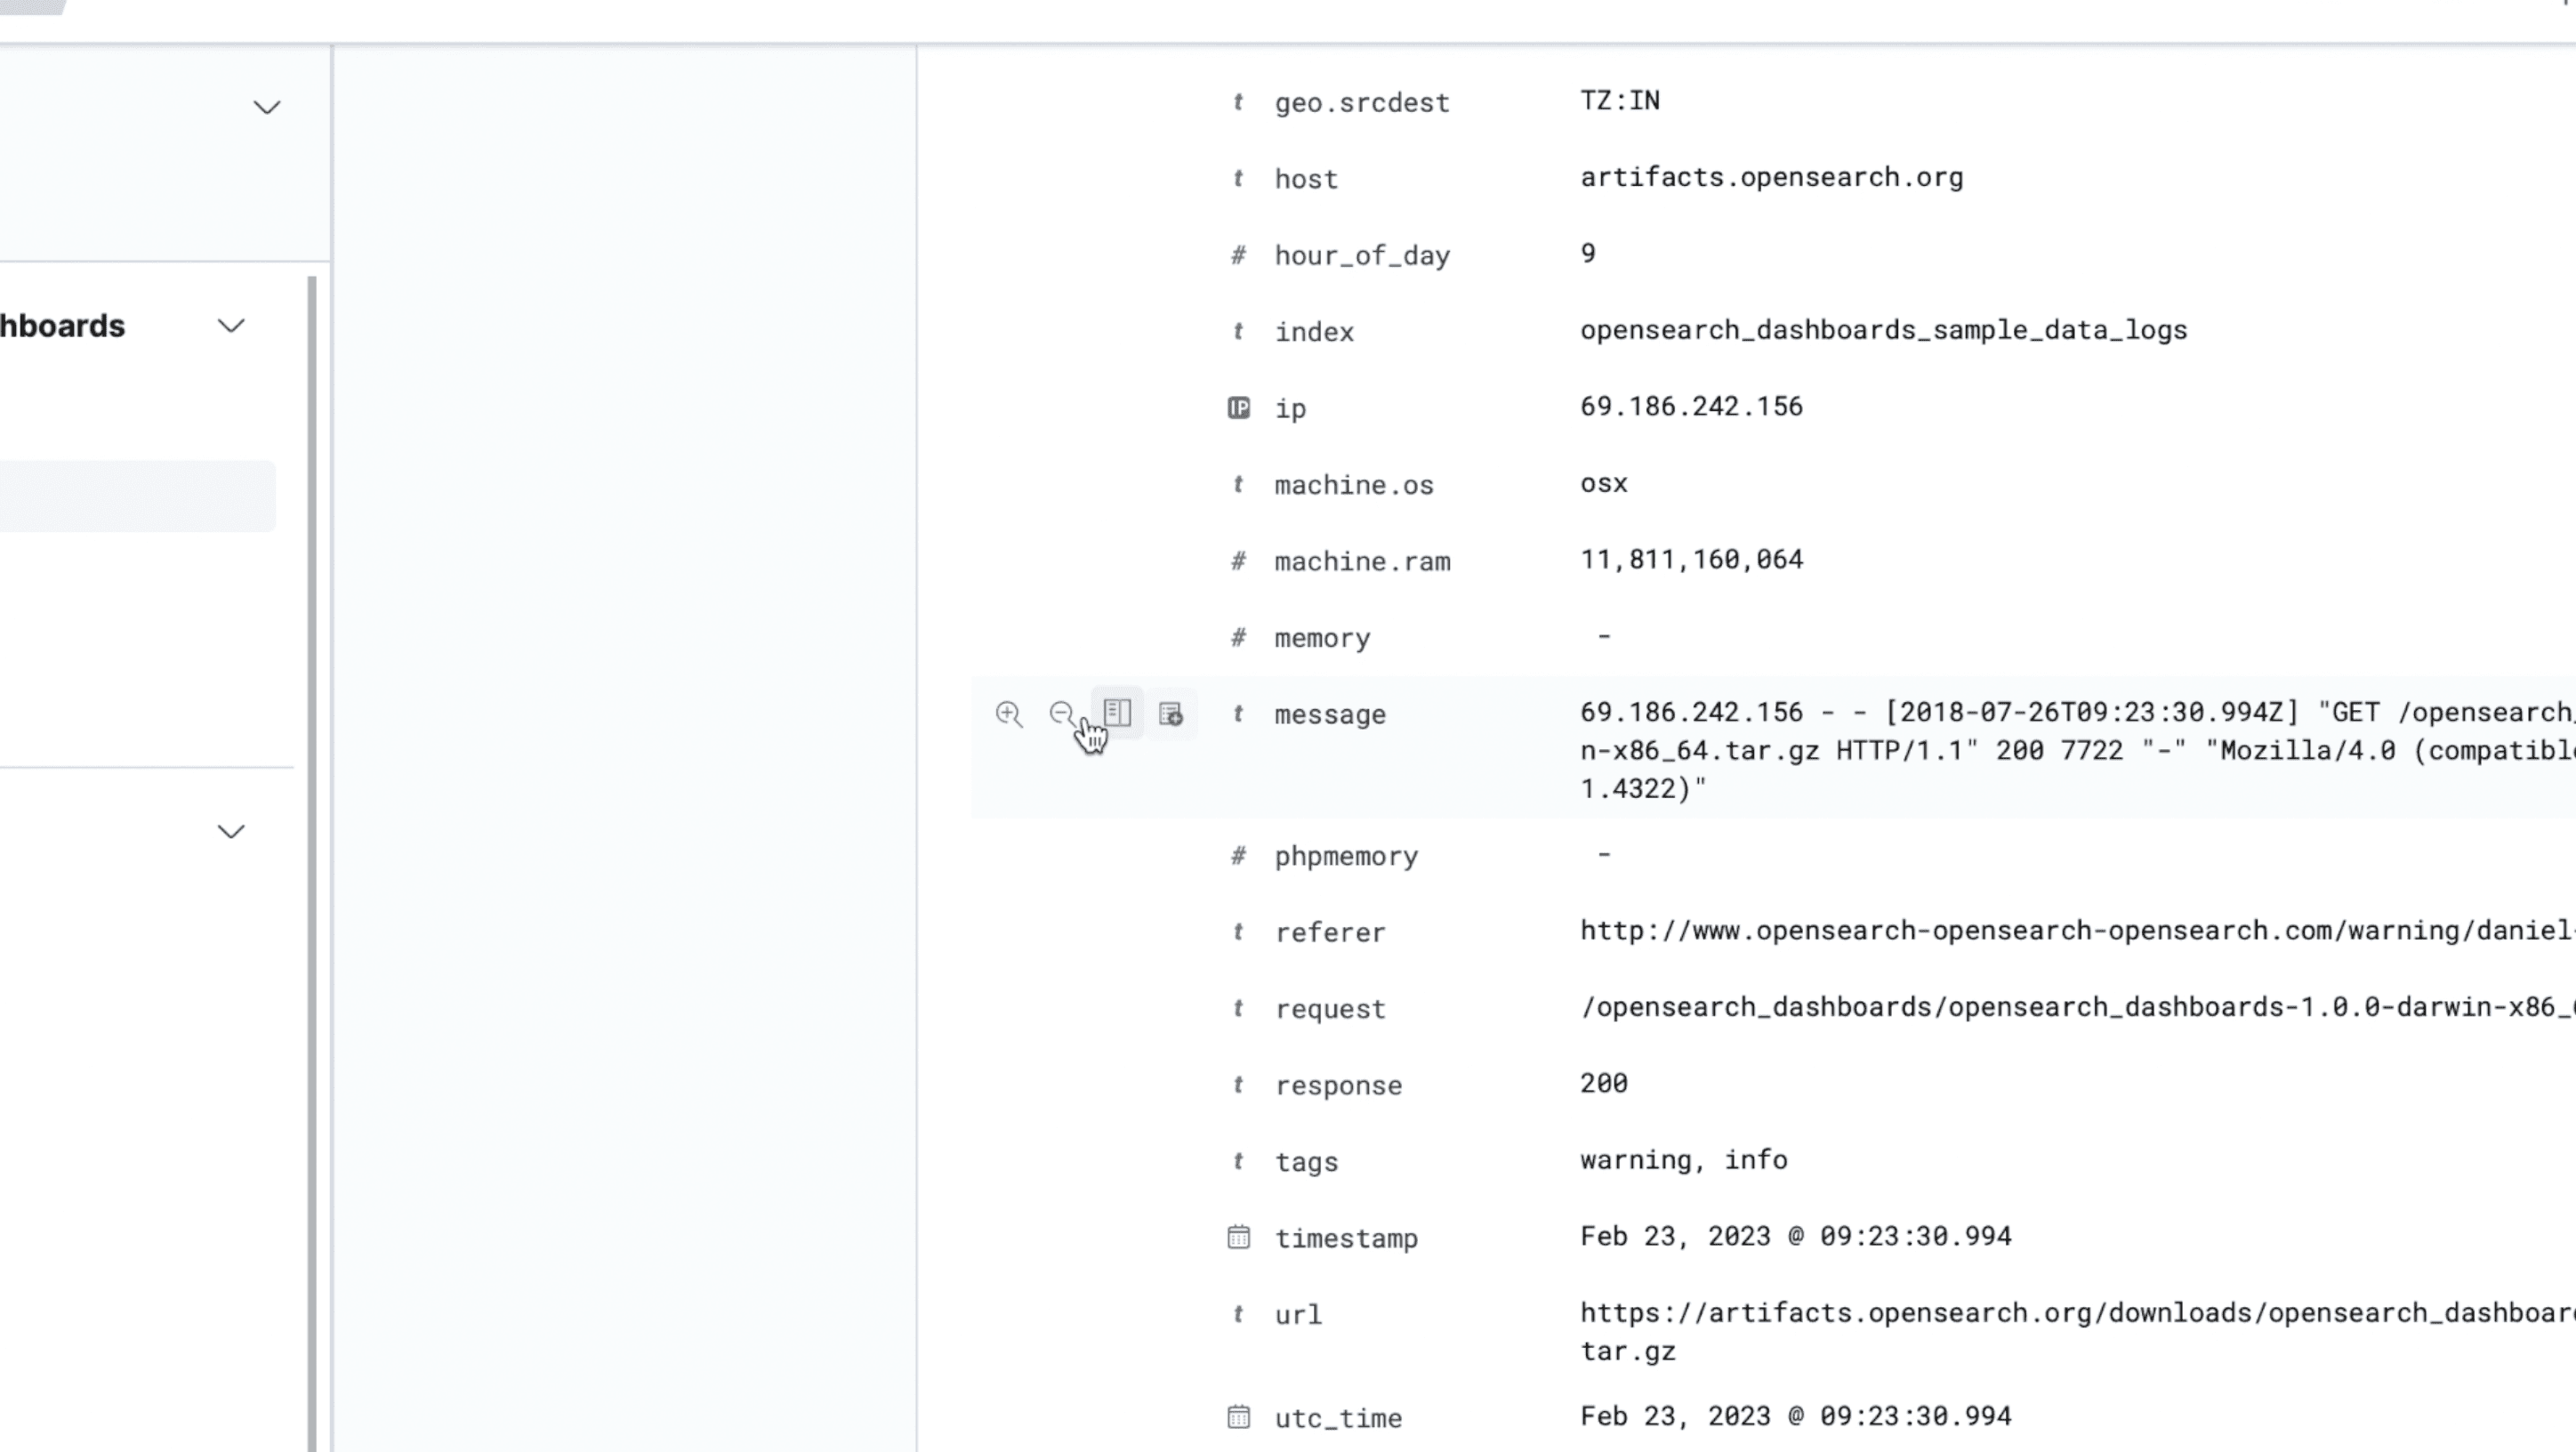
Selecting a field (e.g., status_code, host, user_id) allows you to:
Apply filters based on values (e.g., only show logs where status_code is 500)
Narrow down large datasets to investigate issues or trends
Drill down into specific subsets of your data
See the frequency of field values
Look for spikes, e.g. focus on error.message
Filter on specific service.name or trace.id values
Isolate logs from a particular host, container, or time period
Date Range
You can also change the date range
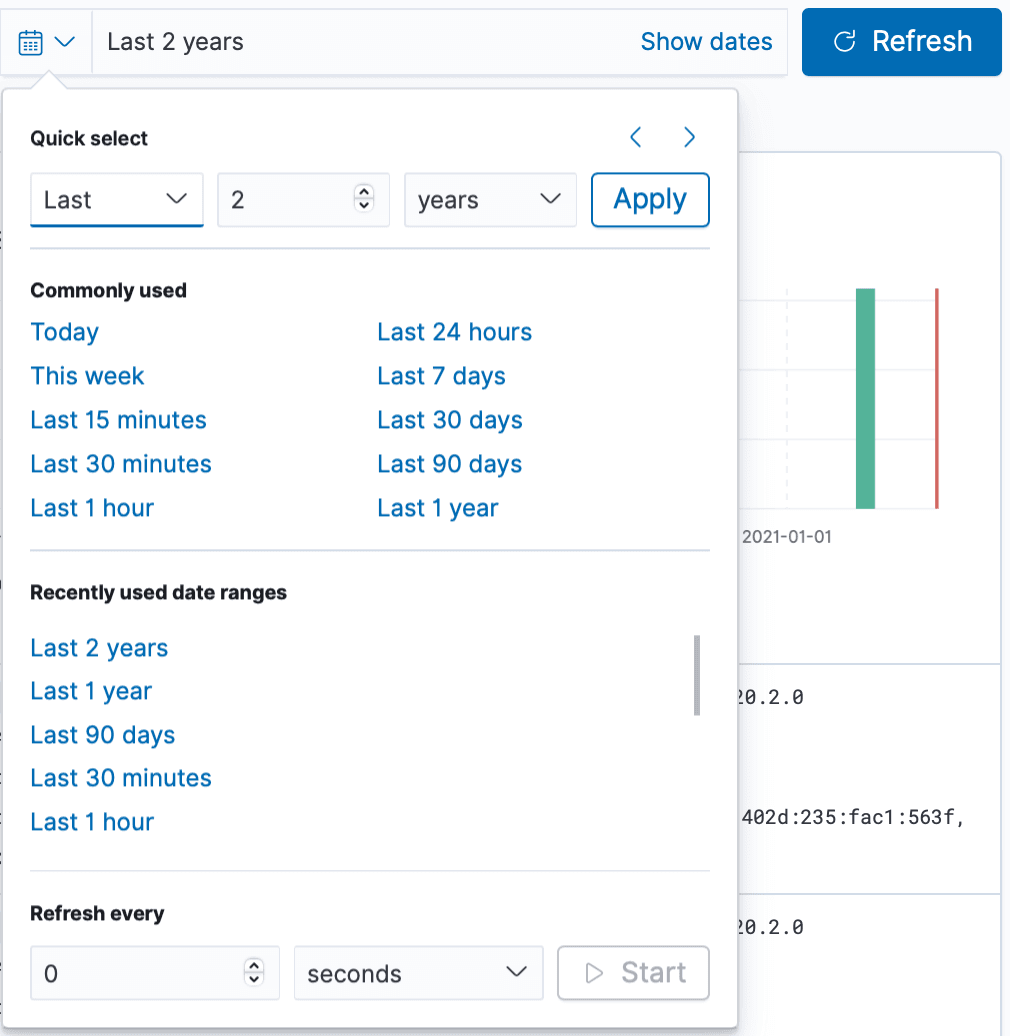
Using the date range in OpenSearch Dashboards is essential for focusing your analysis on the most relevant time period.
You can narrow down to preset filters such as:
Last 15 minutes which is useful for troubleshooting an ongoing incident
This week which can help to review recent deployments or events
or you can set a custom range, e.g. you want to investigate a historical outage or trend.
Date ranges helps reduce noise and lets you focus on data that matters. You can set the date range to align with known events such as error logs around a failed deployment, traffic surges during a product launch and outages or performance drops.
Using the date range properly ensures you're looking at the right data, at the right time, and it’s one of the most powerful tools in OpenSearch Dashboards for actionable analysis.
Dashboards
From the Discovery page, you can click the three lines menu button in the top left of the page to open the side menu and click Dashboards.
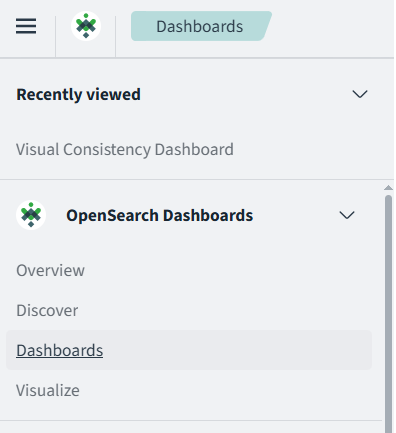
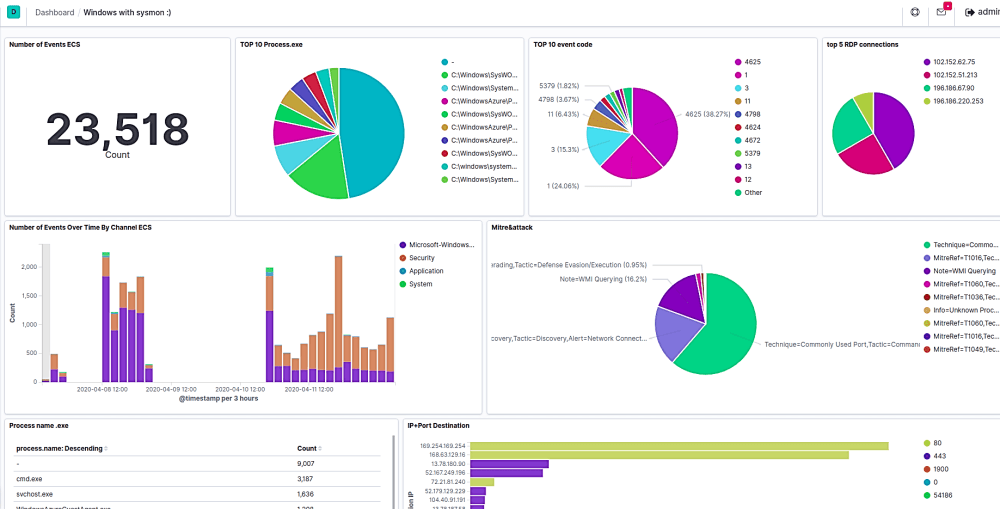
Dashboards are customizable, interactive visual displays that let you monitor, explore, and analyze your data in real time—all in one place.
A dashboard is a collection of visualizations—like charts, graphs, tables, maps, and more—that represent different slices of your log data. Think of it as a command center for understanding what’s happening in your application, infrastructure, or business. Logit.io installs a number of dashboards for you when we create your Log Management stack or when you add OpenSearch Dashboards to your Hosted OpenSearch Stack.
Dashboards help you spot trends, patterns, and anomalies at a glance without running multiple queries manually. You can pull data from logs into one cohesive view and track things like error spikes, latency issues, service performance and application health.
Dashboards can be shared with stakeholders or teams for collaboration, reporting, or incident reviews.
To learn more about OpenSearch you can click here for more information
Alerting
Alerting in OpenSearch Dashboards allows you to monitor your data continuously and get notified when specific conditions are met—such as error spikes, slow response times, or system failures.
Using the Alerting plugin, you can define monitors that run queries on your data and trigger alerts when thresholds are breached. These alerts can be sent via email, Slack, webhooks, or other integrations.
Alerting helps teams react quickly to issues, maintain system uptime, and enforce SLAs—making it an essential part of observability with OpenSearch.
To find out more about Alerting with Logit.io click here for more information.
Summary
OpenSearch Dashboards is a versatile, open-source tool for gaining visibility into your systems and applications. Whether you're analyzing server performance or exploring application logs, it gives you the flexibility to explore and present your data the way you need it. To find out more you can click here for more information.