System Metrics
Ship your System Metrics to your Logit.io stack
The following integration guide will show you how to ship your system metrics to Logit.io using Telegraf and then view them in Grafana.
Metrics
Configure Telegraf to ship your system metrics to Logit.io.
Install Integration
Install Telegraf
This integration allows you to configure a Telegraf agent to send your metrics to Logit.io.
Choose the installation method for your operating system:
When you paste the command below into Powershell it will download the Telegraf zip file.
Once that is complete, press Enter again and the zip file will be extracted into C:\Program Files\InfluxData\telegraf\telegraf-1.34.1.
wget https://dl.influxdata.com/telegraf/releases/telegraf-1.34.1_windows_amd64.zip -UseBasicParsing -OutFile telegraf-1.34.1_windows_amd64.zip
Expand-Archive .\telegraf-1.34.1_windows_amd64.zip -DestinationPath 'C:\Program Files\InfluxData\telegraf'
or in Powershell 7 use:
# Download the Telegraf ZIP file
Invoke-WebRequest -Uri "https://dl.influxdata.com/telegraf/releases/telegraf-1.34.1_windows_amd64.zip" `
                -OutFile "telegraf-1.34.1_windows_amd64.zip" `
                -UseBasicParsing

# Extract the contents of the ZIP file
Expand-Archive -Path ".\telegraf-1.34.1_windows_amd64.zip" `
            -DestinationPath "C:\Program Files\InfluxData\telegraf"
The default configuration file is location at:
C:\Program Files\InfluxData\telegraf\telegraf.conf
Configure the plugin
The configuration below will scrape a selection of system metrics from the machine you have installed Telegraf on and these will be sent to your Logit.io stack. Metrics include CPU, memory and disk usage and system metrics such as system load and uptime.
We are going to use the win_perf_counters input plugin to scrape the CPU usage metric from your Windows host.
# Input plugin to report Windows services info.
# This plugin ONLY supports Windows
[[inputs.win_services]]
  ## Names of the services to monitor. Leave empty to monitor all the available services on the host. Globs accepted. Case sensitive.
  service_names = [
    "LanmanServer",
    "TermService",
    "Win*",
  ]
  excluded_service_names = ['WinRM'] # optional, list of service names to exclude

###############################################################################
# Windows Performance Counters plugin.
# These are the recommended method of monitoring system metrics on windows,
# as the regular system plugins (inputs.cpu, inputs.mem, etc.) rely on WMI,
# which utilize more system resources.
#
# See more configuration examples at:
#   https://github.com/influxdata/telegraf/tree/master/plugins/inputs/win_perf_counters
[[inputs.win_perf_counters]]
  [[inputs.win_perf_counters.object]]
    # Processor usage, alternative to native, reports on a per core.
    ObjectName = "Processor"
    Instances = ["*"]
    Counters = [
      "% Idle Time",
      "% Interrupt Time",
      "% Privileged Time",
      "% User Time",
      "% Processor Time",
    ]
    Measurement = "win_cpu"
    # Set to true to include _Total instance when querying for all (*).
    #IncludeTotal=false
  [[inputs.win_perf_counters.object]]
    # Disk times and queues
    ObjectName = "LogicalDisk"
    Instances = ["*"]
    Counters = [
      "% Idle Time",
      "% Disk Time","% Disk Read Time",
      "% Disk Write Time",
      "% User Time",
      "Current Disk Queue Length",
    ]
    Measurement = "win_disk"
    # Set to true to include _Total instance when querying for all (*).
    #IncludeTotal=false
  [[inputs.win_perf_counters.object]]
    ObjectName = "System"
    Counters = [
      "Context Switches/sec",
      "System Calls/sec",
    ]
    Instances = ["------"]
    Measurement = "win_system"
    # Set to true to include _Total instance when querying for all (*).
    #IncludeTotal=false
  [[inputs.win_perf_counters.object]]
    # Example query where the Instance portion must be removed to get data back,
    # such as from the Memory object.
    ObjectName = "Memory"
    Counters = [
      "Available Bytes",
      "Cache Faults/sec",
      "Demand Zero Faults/sec",
      "Page Faults/sec",
      "Pages/sec",
      "Transition Faults/sec",
      "Pool Nonpaged Bytes",
      "Pool Paged Bytes",
    ]
    # Use 6 x - to remove the Instance bit from the query.
    Instances = ["------"]
    Measurement = "win_mem"
    # Set to true to include _Total instance when querying for all (*).
    #IncludeTotal=false

  [[inputs.win_perf_counters.object]]
    # Example query where the Instance portion must be removed to get data back,
    # such as from the Paging File object.
    ObjectName = "Paging File"
    Counters = [
      "% Usage",
    ]
    Instances = ["_Total"]
    Measurement = "win_swap"

  ### Output
  [[outputs.http]]
    url = "https://@metricsUsername:@metricsPassword@@metrics_id-vm.logit.io:@vmAgentPort/api/v1/write"
    data_format = "prometheusremotewrite"

    [outputs.http.headers]
      Content-Type = "application/x-protobuf"
      Content-Encoding = "snappy"
Start Telegraf
From the location where Telegraf was installed (C:\Program Files\InfluxData\telegraf\telegraf-1.34.1) run the program
providing the chosen configuration file as a parameter:
.\telegraf.exe --config telegraf.confOnce Telegraf is running you should see output similar to the following, which confirms the inputs, output and basic configuration the application has been started with:

Launch Metrics to View Data
Click the 'Launch Metrics' button below to open the infrastructure metrics visualizer.
Launch GrafanaNow, as a simple demonstration we will use Grafana to view some metrics data that is being sent to your Logit.io stack.
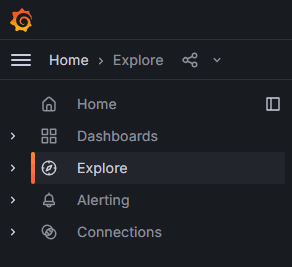
Once Grafana has been opened, click on the Explore option in the left-hand menu:
Under the Metric header you will see 'Select metric'. Open the drop-down menu and scroll to and select 'win_mem_Available_Bytes':
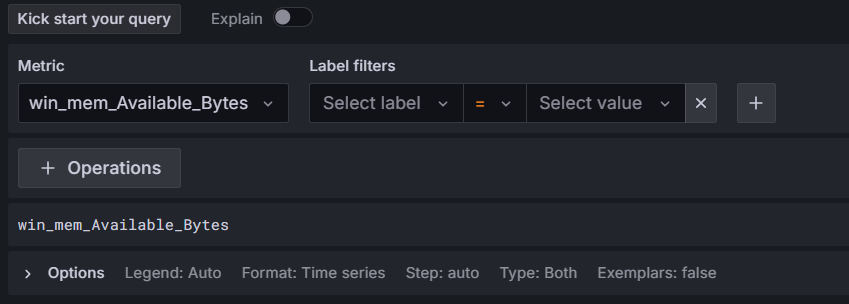
Click on the blue Run query button near the top-right of the screen:
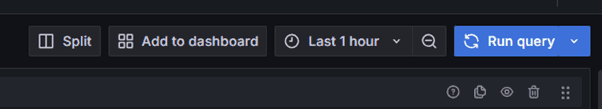
You will now see the metric data displayed and if you click on the blue Run query button this will be updated. You can set this to automatically update by clicking on the arrow on the blue button and choosing the interval at which you want the data to be updated.
When you want to stop Telegraf sending metric data press Ctrl + C in the terminal app / Powershell.
To learn more about Grafana Dashboard click here.
If you need any further assistance with shipping your metric data to Logit.io we're here to help you get started. Feel free to get in contact with our support team by sending us a message via live chat & we'll be happy to assist.