Windows Winlogbeat and Telegraf Setup
Use Winlogbeat and Telegraf to ship logs and metrics to Logit.io
This page provides instructions on how to ship your Windows system logs and metrics to Logit.io via Winlogbeat and Telegraf respectively.
Winlogbeat is a Windows-specific event log-shipping agent installed as a Windows service. It can be used to collect and send event logs to one or more destinations, including Logstash.
Telegraf is a plugin-driven server agent for collecting and reporting metrics. It is used to collect metrics from various sources, including Windows Performance Counters and Windows Services.
If you are only interested in shipping logs, you can ignore the Metrics section and use the Logs section below.
If you are only interested in shipping metrics, you can skip the Logs section and go straight to the Metrics section further down the page.
Logs
Install Integration
Install Winlogbeat
To get started you will need to install winlogbeat. To do this you have two main options:
- Choose the winlogbeat ZIP file (opens in a new tab) (Windows ZIP x86_64) or
- Choose the Microsoft Software Installer MSI (opens in a new tab) file (Windows MSI x86_64 (beta))
To successfully install winlogbeat and set up the required Windows service you will need to have administrator access.
If you have chosen to download the zip file:
- Extract the contents of the zip file into C:\Program Files.
- Rename the extracted folder to winlogbeat
- Open a PowerShell prompt as an Administrator (right-click the PowerShell icon and select Run As Administrator).
- From the PowerShell prompt, run the following commands to install winlogbeat as a Windows service:
cd 'C:\Program Files\@beatname'.\install-service-@beatname.ps1If script execution is disabled on your system, you need to set the execution policy for the current session to allow the script to run. For example:
PowerShell.exe -ExecutionPolicy UnRestricted -File .\install-service-@beatname.ps1For more information about Powershell execution policies see here (opens in a new tab)
If you have chosen to download the winlogbeat.msi file:
- double-click on it and the relevant files will be downloaded.
At the end of the installation process you'll be given the option to open the folder where winlogbeat has been installed.
- Open a PowerShell prompt as an Administrator (right-click the PowerShell icon and select Run As Administrator).
- From the PowerShell prompt, change directory to the location where winlogbeat was installed and run the following command to install winlogbeat as a Windows service:
.\install-service-@beatname.ps1If script execution is disabled on your system, you need to set the execution policy for the current session to allow the script to run. For example:
PowerShell.exe -ExecutionPolicy UnRestricted -File .\install-service-@beatname.ps1For more information about Powershell execution policies see here (opens in a new tab)
Update your configuration file
The configuration file below is pre-configured to send data to your Logit.io Stack via Logstash.
Note: Please make sure the 'hosts' field in the Logstash outputs section is correctly populated. If you are logged into your Logit.io account the 'hosts' field should have been pre-populated with the correct values.
Copy the configuration file below (making the above changes as necessary) and overwrite the contents of winlogbeat.yml. (If you used the installer program to install winlogbeat the winlogbeat.yml file may not exist so you'll need to create it and add the details below).
###################### Logit.io Winlogbeat Configuration ########################
# ============================== Winlogbeat specific options ==============================
winlogbeat.event_logs:
  - name: Application
    ignore_older: 72h

  - name: System

  - name: Security

  - name: Microsoft-Windows-Sysmon/Operational
    tags: [sysmon]

  - name: Windows PowerShell
    event_id: 400, 403, 600, 800

  - name: Microsoft-Windows-PowerShell/Operational
    event_id: 4103, 4104, 4105, 4106

  - name: ForwardedEvents
    tags: [forwarded]

fields:
  type: wineventlog

fields_under_root: true

# ================================== Outputs ===================================
# ------------------------------ Logstash Output -------------------------------
output.logstash:
  hosts: ["@logstash.host:@logstash.sslPort"]
  loadbalance: true
  ssl.enabled: true

  pipeline: "winlogbeat-%{[agent.version]}-routing"

# ================================= Processors =================================
processors:
  - add_host_metadata:
      when.not.contains.tags: forwarded
  - add_cloud_metadata: ~
Validate Configuration
From the PowerShell prompt (in the directory where winlogbeat was installed) run the following command to validate your configuration file:
.\@beatname.exe test config -c .\@beatname.yml -eIf the yml file is valid, winlogbeat will print Config OK.
If there's a problem you should get an error message with details of the error.
Start winlogbeat
From the PowerShell prompt, (in the directory where winlogbeat was installed) run the following command:
Start-Service winlogbeatLaunch OpenSearch Dashboards to View Your Data
Launch OpenSearch DashboardsHow to diagnose no data in Stack
If you don't see data appearing in your stack after following this integration, take a look at the troubleshooting guide for steps to diagnose and resolve the problem or contact our support team and we'll be happy to assist.
Metrics
Install Integration
Install Telegraf
When you paste the command below into Powershell it will download the Telegraf zip file
and then extract that into C:\Program Files\InfluxData\telegraf\telegraf-1.33.0. (You will need
to press enter after the initial download command to run the extract command).
wget `
https://dl.influxdata.com/telegraf/releases/telegraf-1.33.0_windows_amd64.zip `
-UseBasicParsing `
-OutFile telegraf-1.33.0_windows_amd64.zip
Expand-Archive .\telegraf-1.33.0_windows_amd64.zip `
-DestinationPath 'C:\Program Files\InfluxData\telegraf\'
Move the telegraf.exe and telegraf.conf files from C:\Program Files\InfluxData\telegraf\telegraf-1.33.0 to the parent directory C:\Program Files\InfluxData\telegraf
Now navigate to this folder in Powershell.
cd 'C:\Program Files\InfluxData\telegraf'Configure the Telegraf input and output plugins
The configuration file below is pre-configured to scrape the system metrics from your hosts. Add the following to the configuration file (i.e. C:\Program Files\InfluxData\telegraf\telegraf.conf). It includes plugins for both Windows Performance Counters and Windows Services and specifies the output configuration for sending your data to Logit.io.
Note: Please make sure the 'metrics username' , 'metrics password' , 'metrics product Id' and
'vm agent port' , fields in the [[outputs.http]] section are correctly populated.
If you are logged into your Logit.io account the fields should have been pre-populated with the correct values.
# Input plugin to report Windows services info.
# This plugin ONLY supports Windows
[[inputs.win_services]]
  ## Names of the services to monitor. Leave empty to monitor all the available services on the host. Globs accepted. Case sensitive.
  service_names = [
    "LanmanServer",
    "TermService",
    "Win*",
  ]
  excluded_service_names = ['WinRM'] # optional, list of service names to exclude

###############################################################################
# Windows Performance Counters plugin.
# These are the recommended method of monitoring system metrics on windows,
# as the regular system plugins (inputs.cpu, inputs.mem, etc.) rely on WMI,
# which utilize more system resources.
#
# See more configuration examples at:
#   https://github.com/influxdata/telegraf/tree/master/plugins/inputs/win_perf_counters
[[inputs.win_perf_counters]]
  [[inputs.win_perf_counters.object]]
    # Processor usage, alternative to native, reports on a per core.
    ObjectName = "Processor"
    Instances = ["*"]
    Counters = [
      "% Idle Time",
      "% Interrupt Time",
      "% Privileged Time",
      "% User Time",
      "% Processor Time",
    ]
    Measurement = "win_cpu"
    # Set to true to include _Total instance when querying for all (*).
    #IncludeTotal=false
  [[inputs.win_perf_counters.object]]
    # Disk times and queues
    ObjectName = "LogicalDisk"
    Instances = ["*"]
    Counters = [
      "% Idle Time",
      "% Disk Time","% Disk Read Time",
      "% Disk Write Time",
      "% User Time",
      "Current Disk Queue Length",
    ]
    Measurement = "win_disk"
    # Set to true to include _Total instance when querying for all (*).
    #IncludeTotal=false
  [[inputs.win_perf_counters.object]]
    ObjectName = "System"
    Counters = [
      "Context Switches/sec",
      "System Calls/sec",
    ]
    Instances = ["------"]
    Measurement = "win_system"
    # Set to true to include _Total instance when querying for all (*).
    #IncludeTotal=false
  [[inputs.win_perf_counters.object]]
    # Example query where the Instance portion must be removed to get data back,
    # such as from the Memory object.
    ObjectName = "Memory"
    Counters = [
      "Available Bytes",
      "Cache Faults/sec",
      "Demand Zero Faults/sec",
      "Page Faults/sec",
      "Pages/sec",
      "Transition Faults/sec",
      "Pool Nonpaged Bytes",
      "Pool Paged Bytes",
    ]
    # Use 6 x - to remove the Instance bit from the query.
    Instances = ["------"]
    Measurement = "win_mem"
    # Set to true to include _Total instance when querying for all (*).
    #IncludeTotal=false

  [[inputs.win_perf_counters.object]]
    # Example query where the Instance portion must be removed to get data back,
    # such as from the Paging File object.
    ObjectName = "Paging File"
    Counters = [
      "% Usage",
    ]
    Instances = ["_Total"]
    Measurement = "win_swap"

    [[outputs.http]]
    url = "https://@metricsUsername:@metricsPassword@@metrics_id-vm.logit.io:@vmAgentPort/api/v1/write"
    data_format = "prometheusremotewrite"

    [outputs.http.headers]
      Content-Type = "application/x-protobuf"
      Content-Encoding = "snappy"
Read more about how to configure data scraping and configuration options for Windows Performance Counters here (opens in a new tab)
Read more about how to configure data scraping and configuration options for Windows Services here (opens in a new tab)
Start Telegraf
Run the following command to install Telegraf as a Windows service.
.\telegraf.exe `
--config "C:\Program Files\InfluxData\telegraf\telegraf.conf" `
service install
To test that the installation works, enter the following command:
.\telegraf.exe `
--config C:\"Program Files"\InfluxData\telegraf\telegraf.conf --test
This will run Telegraf in test mode and output the metrics to the console. If you see the metrics output in the console, it means that Telegraf is working correctly.
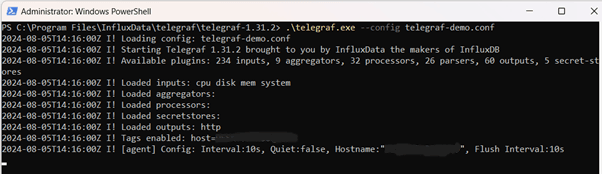
To start collecting data run the following command:
Start-Service telegrafOnce Telegraf is running you should see output similar to the following, which confirms the inputs and basic configuration the application has been started (there will be a lot more lines of output but as long as there are no errors you are good to go):