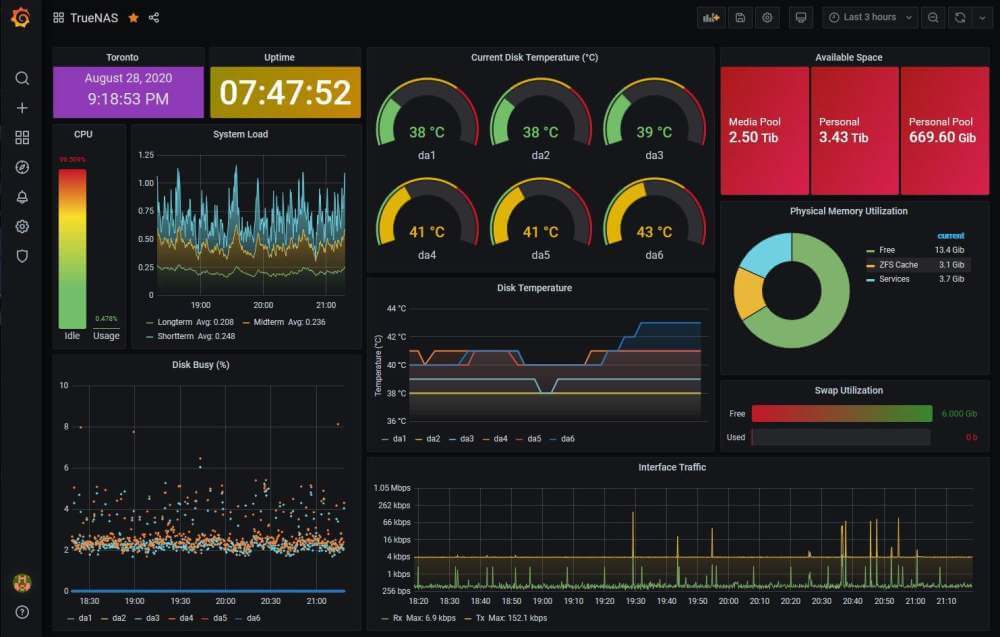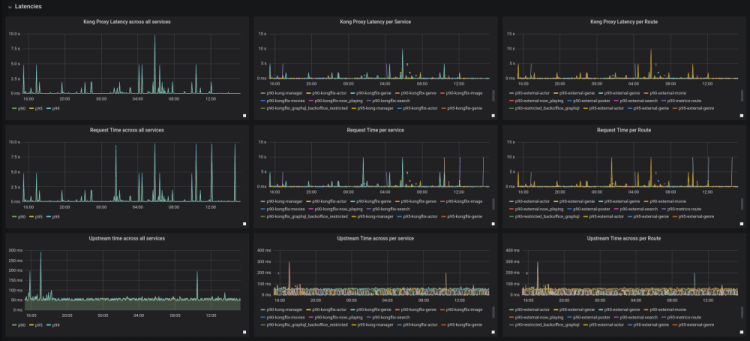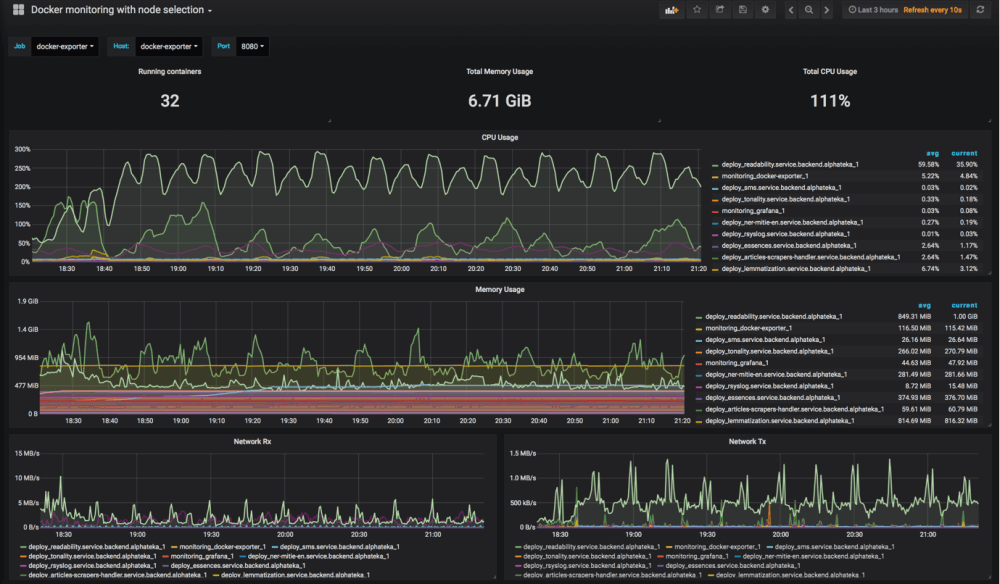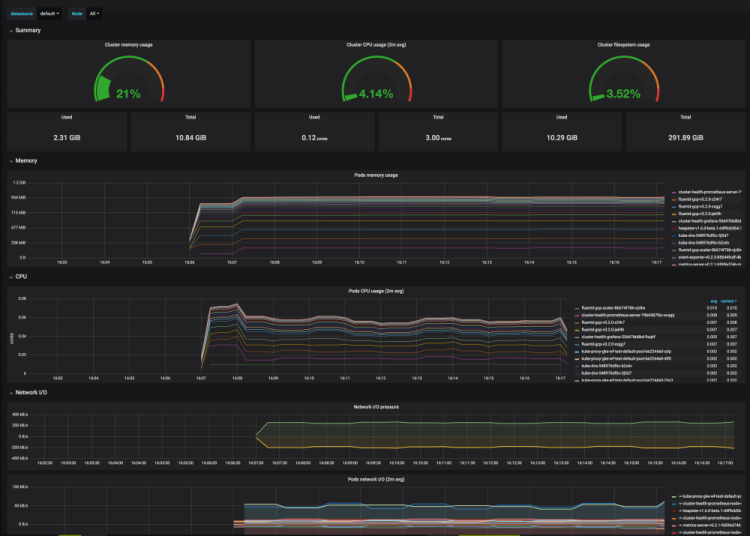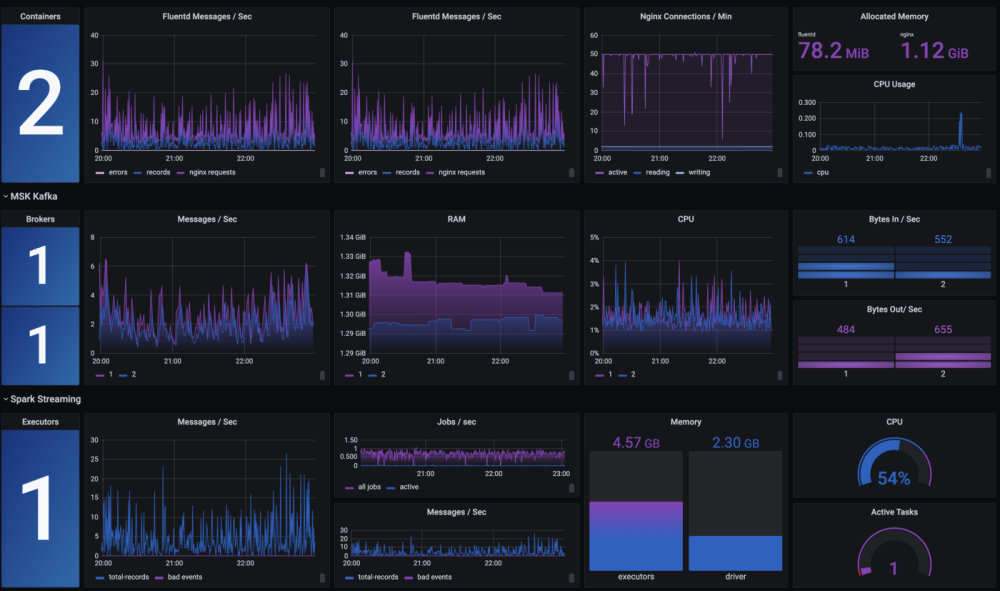

The Best In Metrics Visualisation
If you are already familiar with the wealth of monitoring and visualisation capabilities that Grafana can provide then you'll have probably already wished that you could get started with this comprehensive open-source solution for metrics and logs.
One of the biggest blockers to launching Grafana quickly is due to its initial setup and configuration. It can be exceedingly tedious to make the most out of your metrics and start creating detailed visualisations with Grafana.
As Logit.io hosts all of the most essential tools for open-source logging and metrics management, you'll no longer have to choose between only using Kibana, Grafana or the OpenSearch Elastic Stack to manage your data. Experience the best attributes by using all of these solutions and their integrations within a single centralised platform.
Ready to unlock the full potential of Grafana for your organization? Book a Grafana demo with us today and experience the power of data visualization firsthand. Our team of experts will guide you through the key features and capabilities of Grafana, demonstrating how you can use it to monitor everything from system performance to business KPIs.
In the event that you don't wish to speak to a specialist and you are ready to start exploring Grafana then feel free to sign up above for a 14-day free trial with no commitments.


