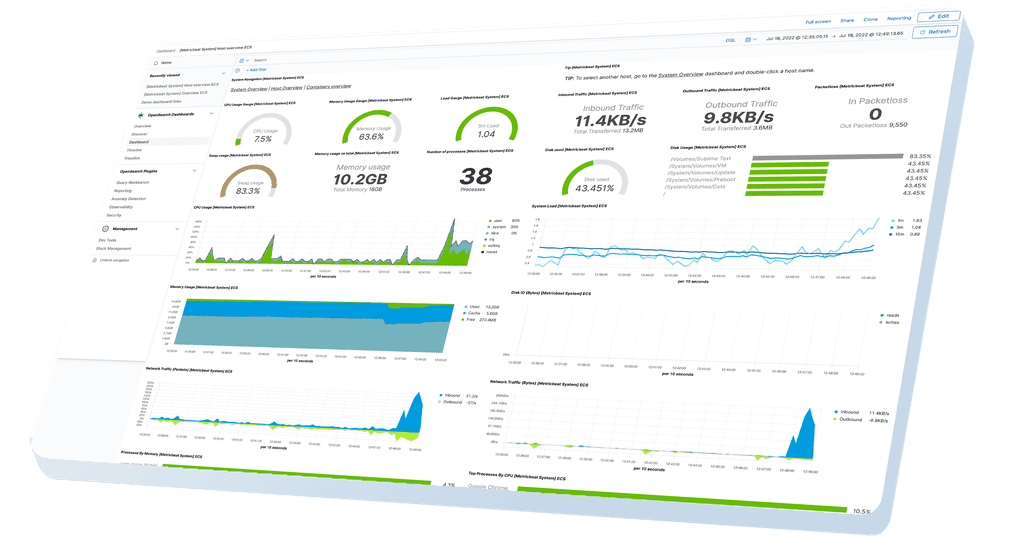
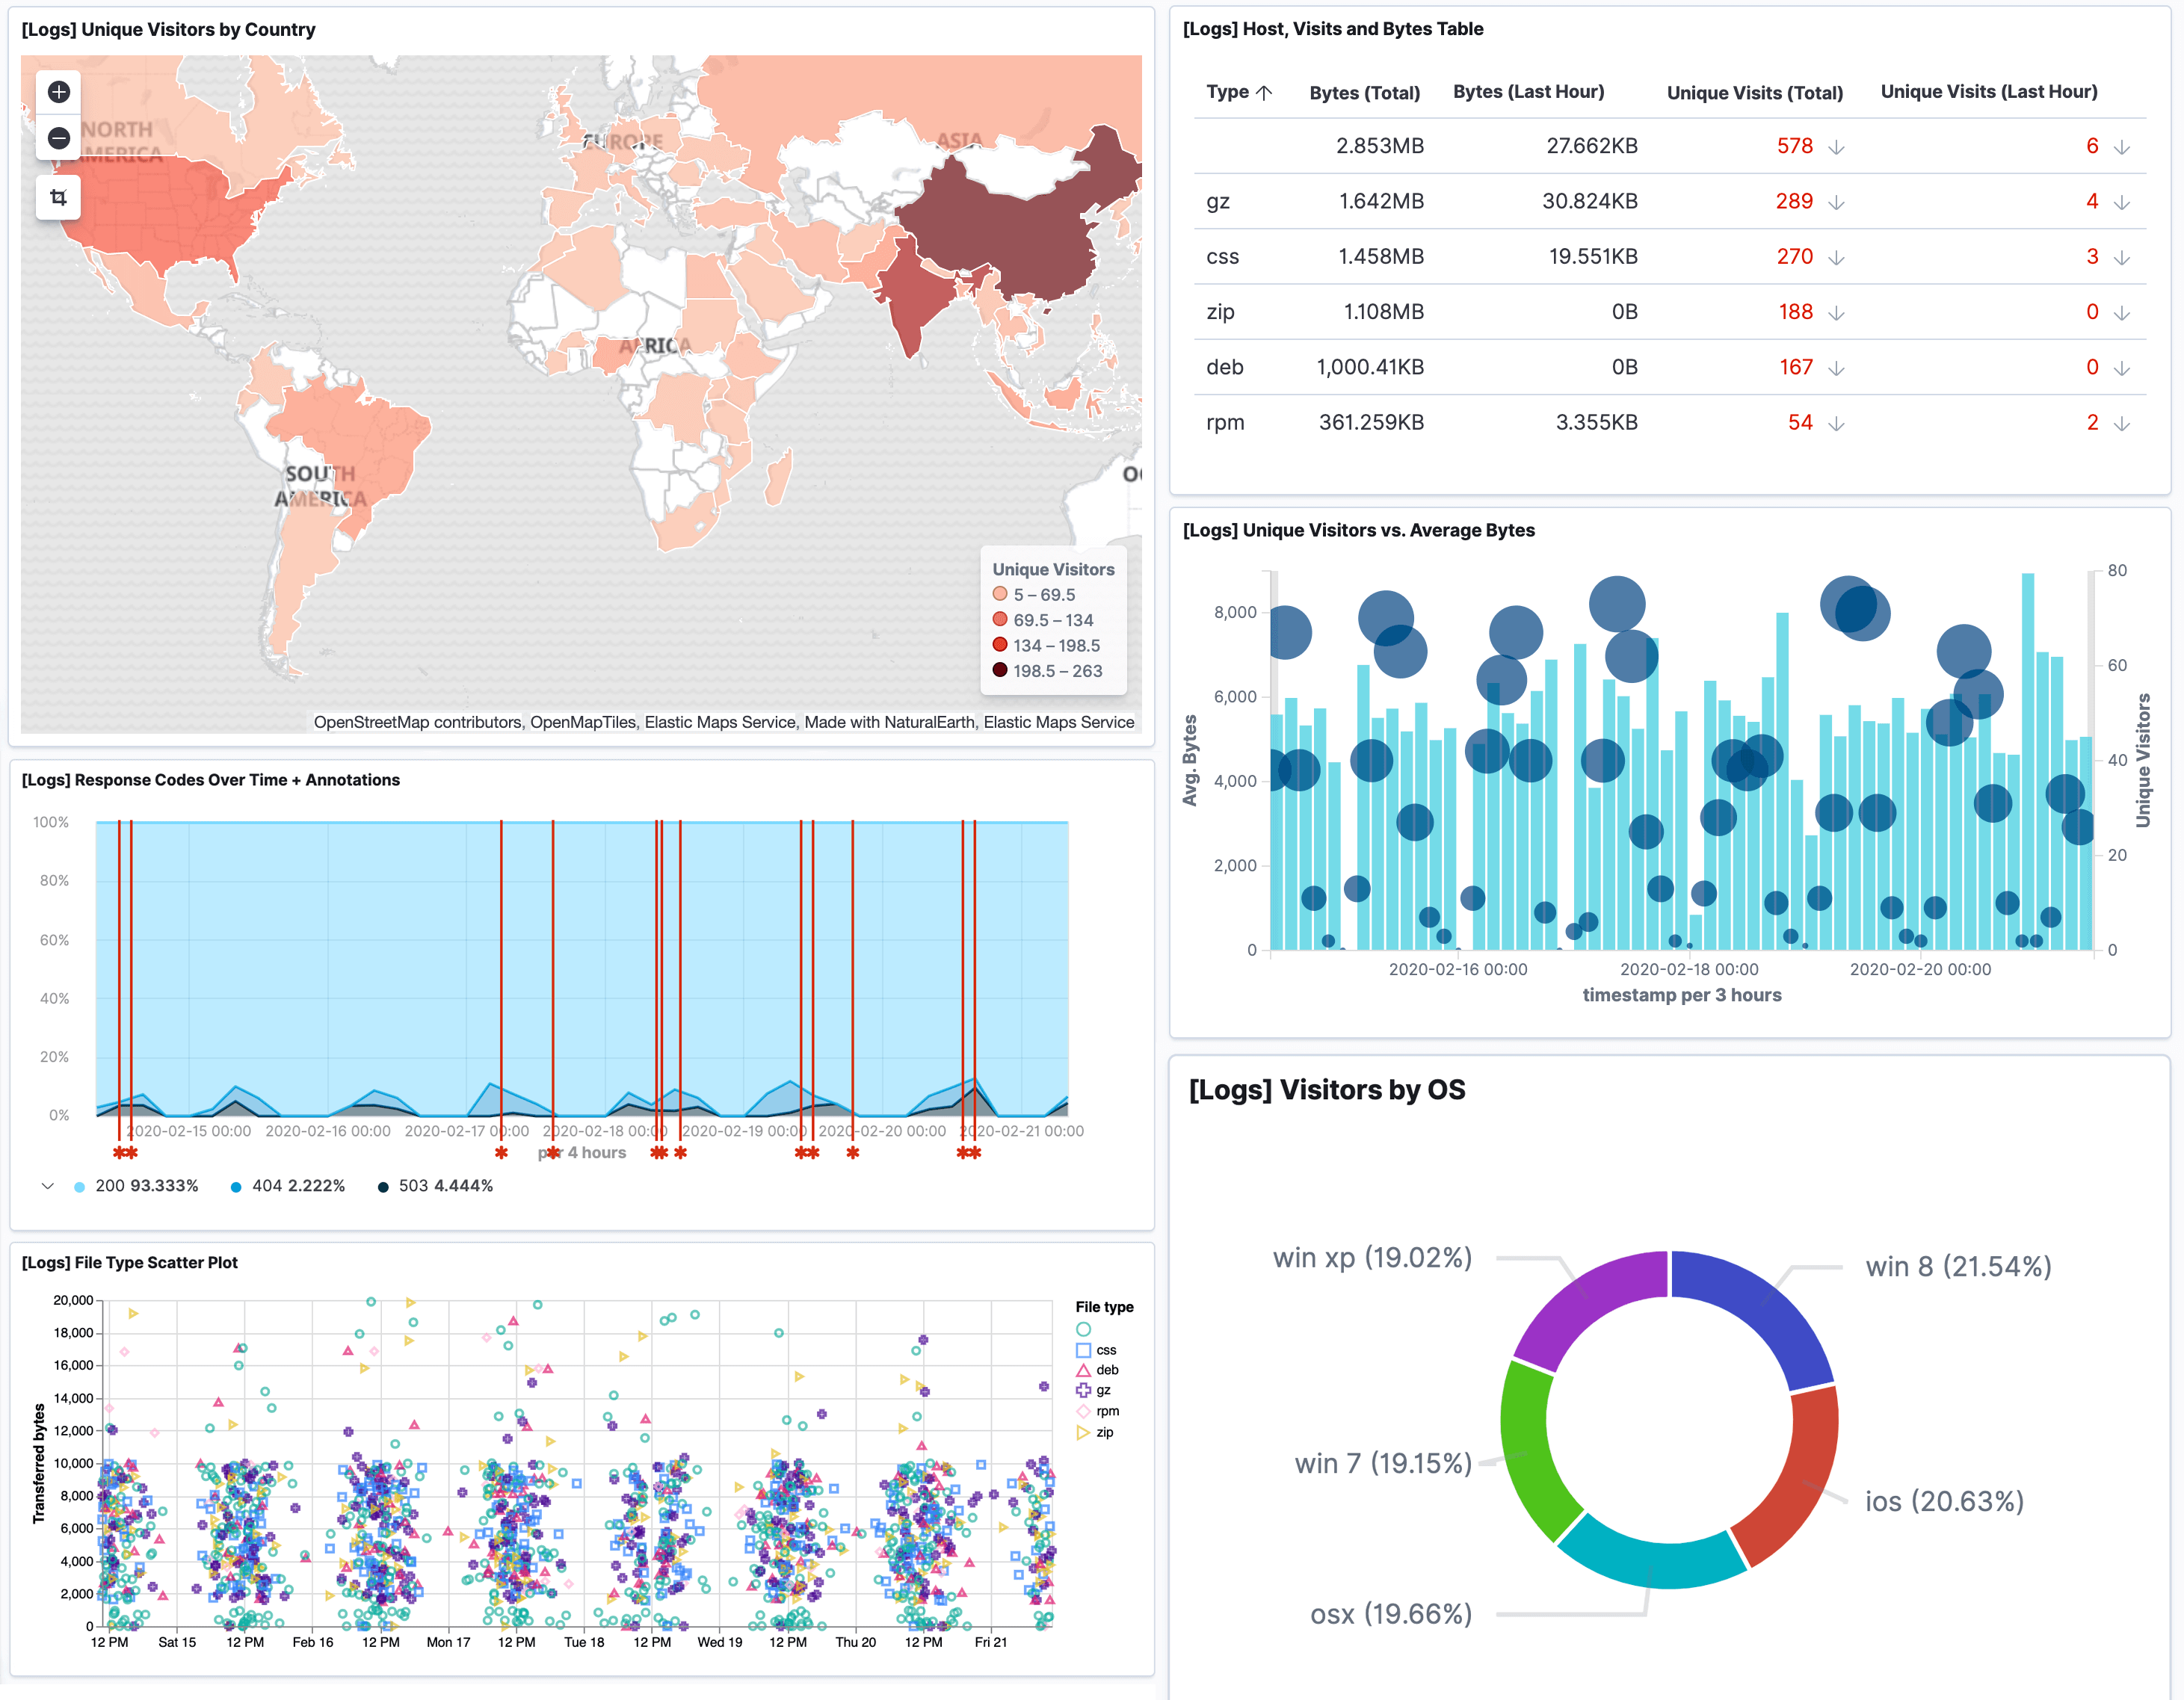
Powerful Visualization Options: While Logit.io offers both Grafana and Kibana for metrics dashboards, many technical teams prefer Grafana for its specialized time-series visualization capabilities. Our platform fully leverages Grafana's extensive library of charts, graphs, and visualization types.
Custom Dashboard Creation: Design tailored dashboards that align with your specific business and technical requirements. Our platform supports the full range of Grafana visualization tools, allowing you to create insightful, actionable views of your metrics data with minimal effort.
Cross-Team Collaboration: Improve communication between engineering, operations, and business teams with shareable, interactive dashboards. Grafana's intuitive visualization makes complex metrics data accessible to stakeholders across your organization, fostering data-driven decision-making.
Alerting Integration: Configure sophisticated alerting workflows based on metrics thresholds and patterns. Our platform integrates seamlessly with popular alerting tools, enabling proactive incident response and reduced mean time to resolution (MTTR).


