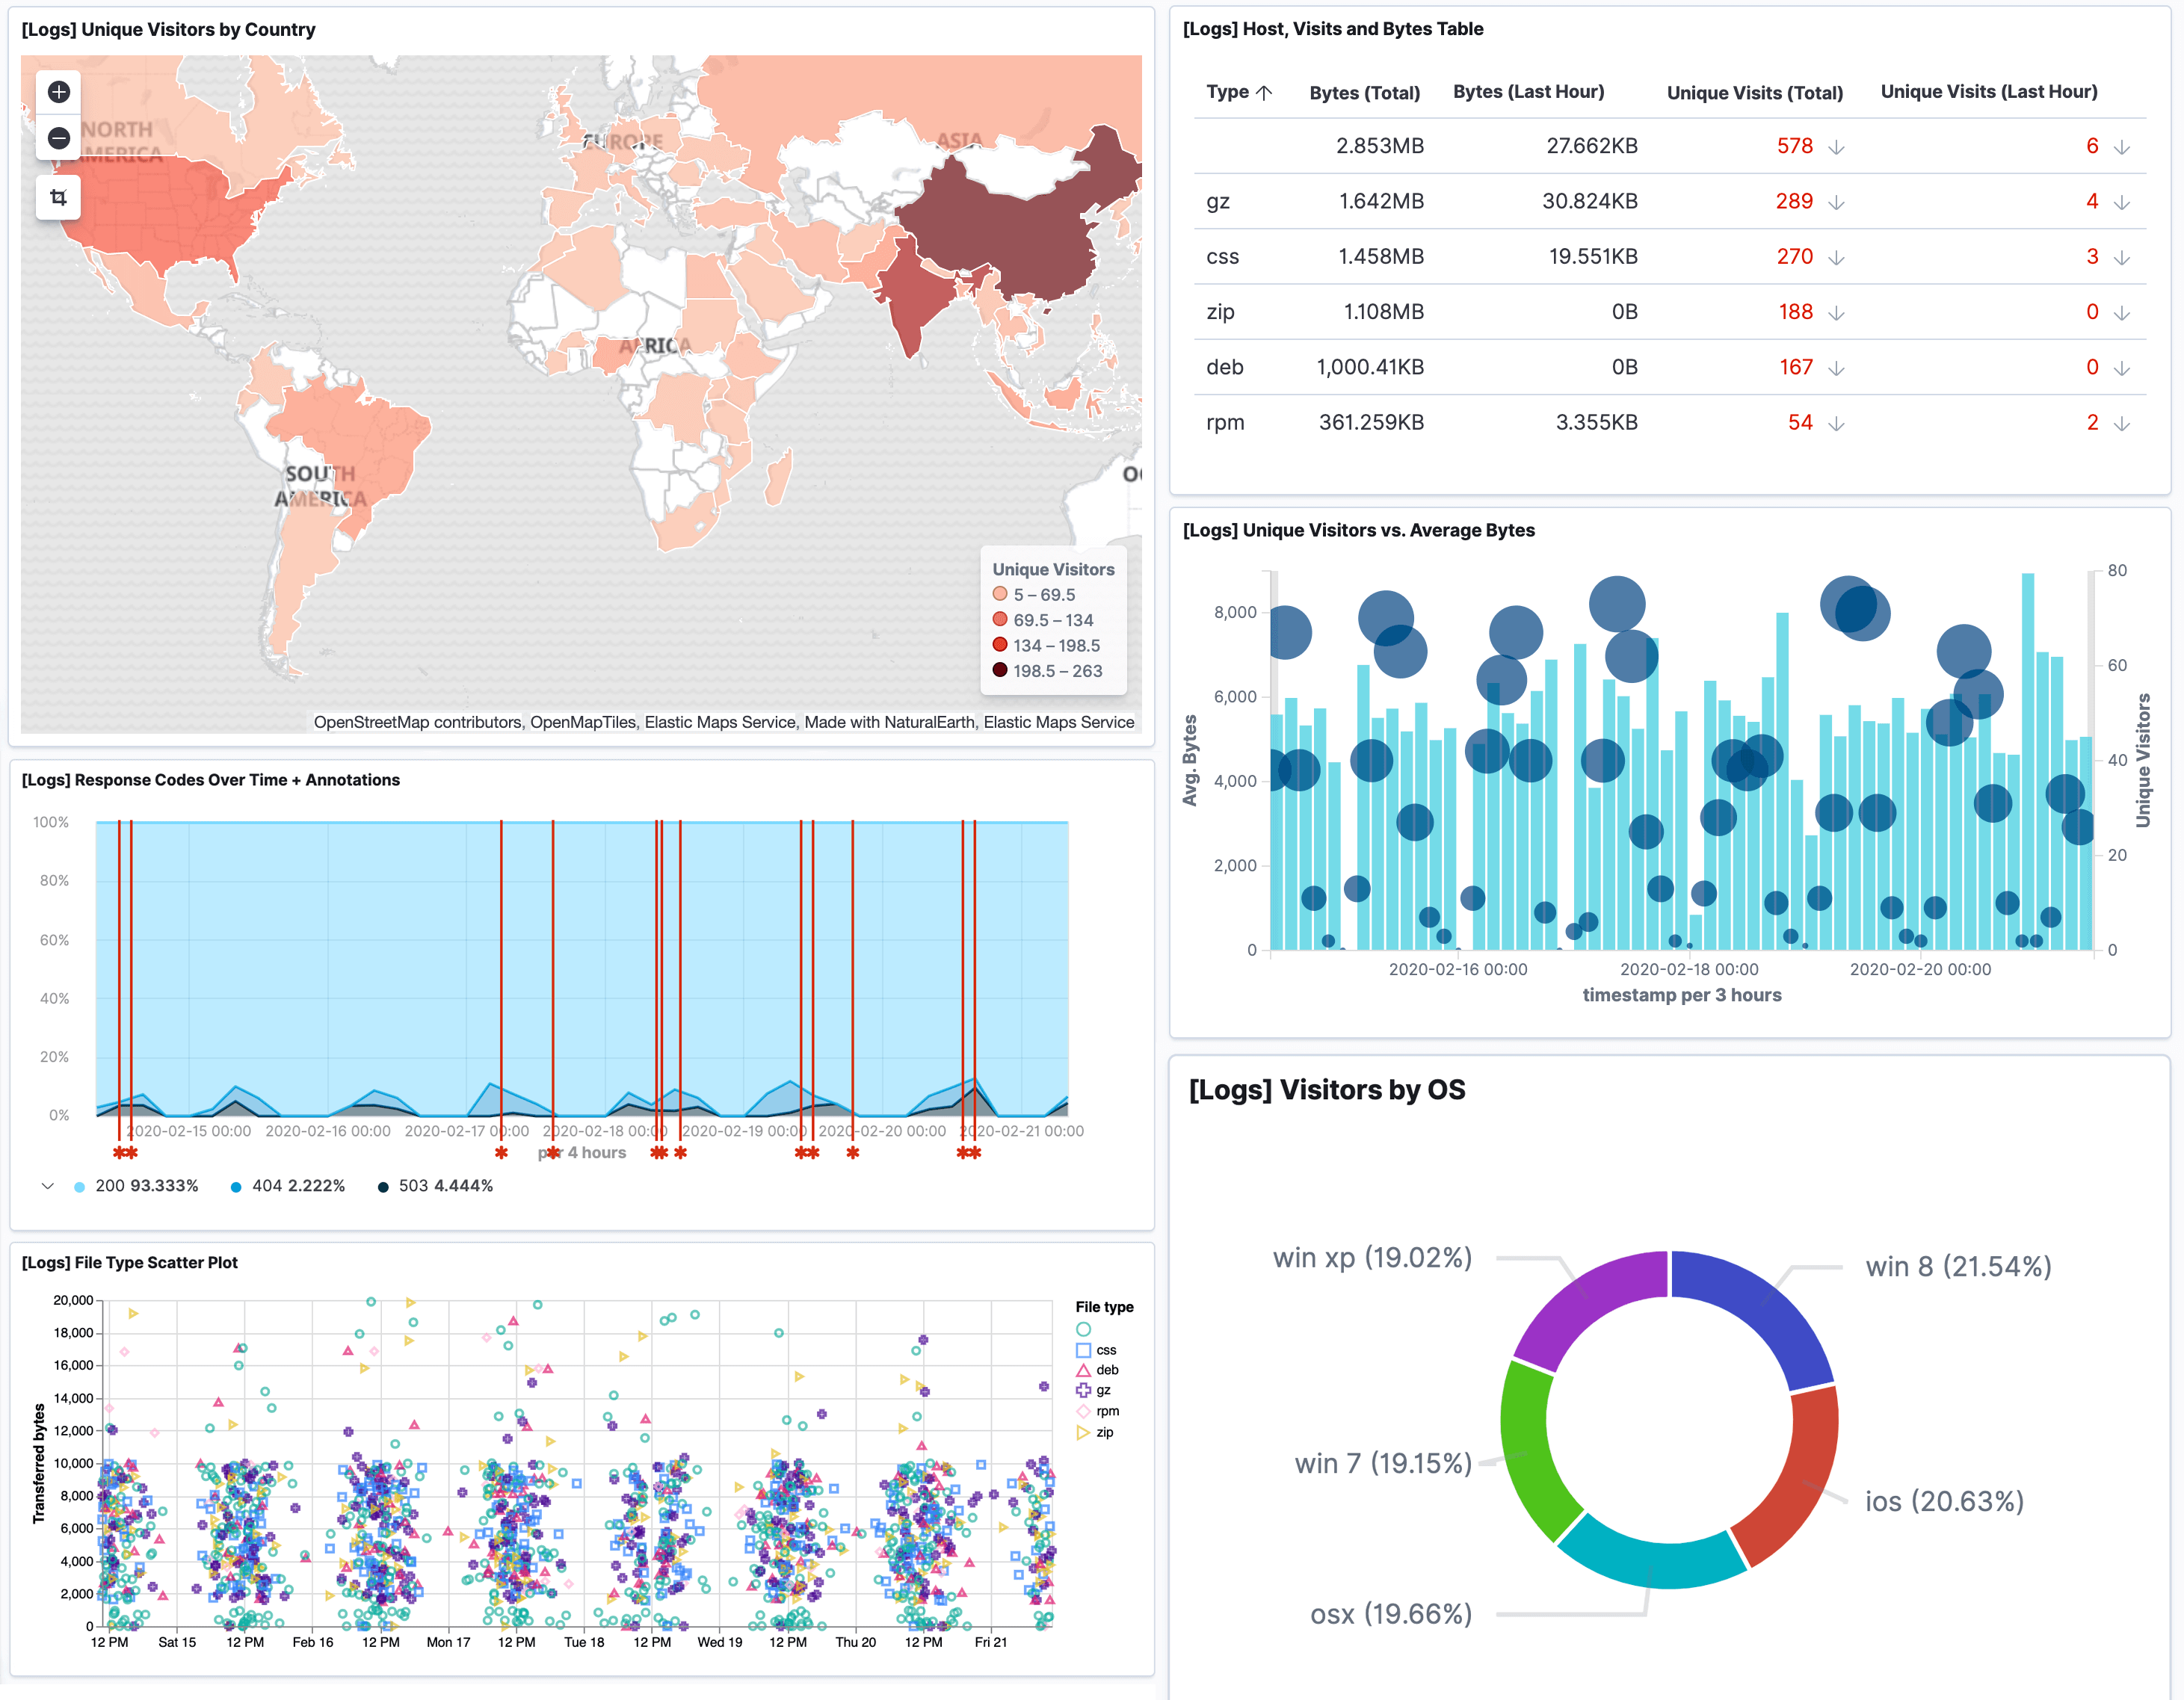
Kibana is an open-source user interface for data visualisation, exploration and detailed reporting. Kibana forms a key part of both the ELK & Elastic Stack alongside Elasticsearch and commonly used in association with Logstash.
The most common use case for Kibana is log analysis as it can easily use unstructured and semi-structured log files created by a vast array of applications, services, and servers to build interactive reporting dashboards.
Some other often underutilised use cases for Kibana include its data visualisation capabilities for security & compliance auditing, sales and marketing, cloud monitoring and APM.
Kibana forms the powerful data visualisation arm of the ELK stack (which also contains Logstash, Elasticsearch & Beats).
While ELK and the Elastic Stack are popular open-source tools for log management, business intelligence & cloud monitoring. When it comes to maintaining staging, hosting, and upgrading these tools it quickly becomes increasingly difficult when additional services are added to your business's infrastructure.
This is where the Logit.io platform can assist in providing ready-to-launch scalable Kibana as a service, saving your engineers time and money otherwise spent on training and maintenance, instead of deploying code, big data analysis and error resolution.


