Apache HTTP Server
Ship Apache access and error logs along with your Server Metrics via Telegraf to your Logit.io Stack
Follow the steps below to send your observability data to Logit.io
Logs
Use Filebeat to ship access and error logs from Apache to your Logit.io Stack.
Install Integration
Install Filebeat
To get started you will need to install filebeat. To do this you have two main options:
- Choose the filebeat (opens in a new tab) ZIP file (Windows ZIP x86_64) or
- Choose the Microsoft Software Installer MSI (opens in a new tab) file (Windows MSI x86_64 (beta))
To successfully install filebeat and set up the required Windows service you will need to have administrator access.
If you have chosen to download the zip file:
- Extract the contents of the zip file into C:\Program Files.
- Rename the extracted folder to filebeat
- Open a PowerShell prompt as an Administrator (right-click the PowerShell icon and select Run As Administrator).
- From the PowerShell prompt, run the following commands to install filebeat as a Windows service:
cd 'C:\Program Files\filebeat'.\install-service-filebeat.ps1If script execution is disabled on your system, you need to set the execution policy for the current session to allow the script to run. For example:
PowerShell.exe -ExecutionPolicy UnRestricted -File .\install-service-filebeat.ps1For more information about Powershell execution policies see here (opens in a new tab).
If you have chosen to download the filebeat.msi file:
- double-click on it and the relevant files will be downloaded.
At the end of the installation process you'll be given the option to open the folder where filebeat has been installed.
- Open a PowerShell prompt as an Administrator (right-click the PowerShell icon and select Run As Administrator).
- From the PowerShell prompt, change directory to the location where filebeat was installed and run the following command to install filebeat as a Windows service:
.\install-service-filebeat.ps1If script execution is disabled on your system, you need to set the execution policy for the current session to allow the script to run. For example:
PowerShell.exe -ExecutionPolicy UnRestricted -File .\install-service-filebeat.ps1For more information about Powershell execution policies see here (opens in a new tab).
The default configuration file is located at:
C:\Program Files\filebeat\filebeat.yml
Update Your Configuration File
The configuration file below is pre-configured to send data to your Logit.io Stack via Logstash.
Copy the configuration file below and overwrite the contents of filebeat.yml.
# ============================== Filebeat modules ==============================
filebeat.config.modules:
  path: ${path.config}/modules.d/*.yml
  reload.enabled: false
  #reload.period: 10s

# ================================== Outputs ===================================
# ------------------------------ Logstash Output -------------------------------
output.logstash:
  hosts: ["@logstash.host:@logstash.sslPort"]
  loadbalance: true
  ssl.enabled: true

# ================================= Processors =================================
processors:
  - add_host_metadata:
      when.not.contains.tags: forwarded
  - add_cloud_metadata: ~
  - add_docker_metadata: ~
  - add_kubernetes_metadata: ~
If you're running Filebeat 7 add this code block to the end. Otherwise, you can leave it out.
# ... For Filebeat 7 only ...
filebeat.registry.path: /var/lib/filebeat
If you're running Filebeat 6 add this code block to the end. Otherwise, you can leave it out.
# ... For Filebeat 6 only ...
registry_file: /var/lib/filebeat/registry
Validate your YAML
It's a good idea to run the configuration file through a YAML validator to rule out indentation errors, clean up extra characters, and check if your YAML file is valid. Yamllint.com (opens in a new tab) is a great choice.
Validate Configuration
.\@beatname.exe test config -c @beatname.ymlIf the yml file is invalid, @beatname will print a description of the error. For example, if the
output.logstash section was missing, @beatname would print no outputs are defined, please define one under the output section
Start filebeat
To start Filebeat, run in Powershell:
Start-Service filebeatModule Configuration (Advanced)
Additional module configuration can be done using the per module config files located in the modules.d folder, most commonly this would be to read logs from a non-default location
deb/rpm /etc/filebeat/modules.d/apache.yml
mac/win <EXTRACTED_ARCHIVE>/modules.d/apache.yml
- module: apache
  # Access logs
  access:
    enabled: true

  # Set custom paths for the log files. If left empty,
  # Filebeat will choose the paths depending on your OS.
  # var.paths: ["/custom/path/to/logs"]

  # Error logs
  error:
    enabled: true

  # Set custom paths for the log files. If left empty,
  # Filebeat will choose the paths depending on your OS.
  # var.paths: ["/custom/path/to/logs"]
Launch OpenSearch Dashboards to View Your Data
Launch OpenSearch DashboardsHow to diagnose no data in Stack
If you don't see data appearing in your stack after following this integration, take a look at the troubleshooting guide for steps to diagnose and resolve the problem or contact our support team and we'll be happy to assist.
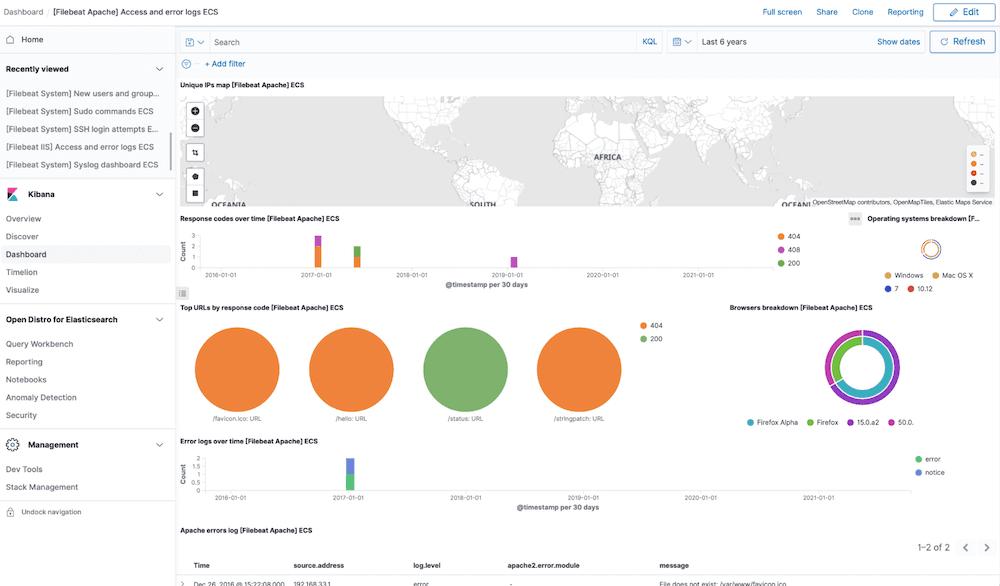
Apache Dashboard
The Apache module comes with predefined Kibana dashboards. To view your dashboards for any of your Logit.io stacks, launch Logs and choose Dashboards.
Metrics
Configure Telegraf to ship Apache HTTP Server metrics to your Logit.io stacks.
Install Integration
Install Telegraf
This integration allows you to configure a Telegraf agent to send your metrics to Logit.io.
Choose the installation method for your operating system:
When you paste the command below into Powershell it will download the Telegraf zip file.
Once that is complete, press Enter again and the zip file will be extracted into C:\Program Files\InfluxData\telegraf\telegraf-1.34.1.
wget https://dl.influxdata.com/telegraf/releases/telegraf-1.34.1_windows_amd64.zip -UseBasicParsing -OutFile telegraf-1.34.1_windows_amd64.zip
Expand-Archive .\telegraf-1.34.1_windows_amd64.zip -DestinationPath 'C:\Program Files\InfluxData\telegraf'
or in Powershell 7 use:
# Download the Telegraf ZIP file
Invoke-WebRequest -Uri "https://dl.influxdata.com/telegraf/releases/telegraf-1.34.1_windows_amd64.zip" `
                -OutFile "telegraf-1.34.1_windows_amd64.zip" `
                -UseBasicParsing

# Extract the contents of the ZIP file
Expand-Archive -Path ".\telegraf-1.34.1_windows_amd64.zip" `
            -DestinationPath "C:\Program Files\InfluxData\telegraf"
The default configuration file is location at:
C:\Program Files\InfluxData\telegraf\telegraf.conf
Configure Telegraf
The configuration file below is pre-configured to scrape the system metrics from your hosts, add the following code to the configuration file telegraf.conf from the previous step.
### Read Apache status information (mod_status)
[[inputs.apache]]
  ## An array of URLs to gather from, must be directed at the machine
  ## readable version of the mod_status page including the auto query string.
  ## Default is "http://localhost/server-status?auto".
  urls = ["http://localhost/server-status?auto"]

  ## Credentials for basic HTTP authentication.
  # username = "myuser"
  # password = "mypassword"

  ## Maximum time to receive response.
  # response_timeout = "5s"

  ## Optional TLS Config
  # tls_ca = "/etc/telegraf/ca.pem"
  # tls_cert = "/etc/telegraf/cert.pem"
  # tls_key = "/etc/telegraf/key.pem"
  ## Use TLS but skip chain & host verification
  # insecure_skip_verify = false

### System metrics
[[inputs.disk]]
[[inputs.net]]
[[inputs.mem]]
[[inputs.system]]
[[inputs.cpu]]
  percpu = false
  totalcpu = true
  collect_cpu_time = true
  report_active = true

### Output
[[outputs.http]]
  url = "https://@metricsUsername:@metricsPassword@@metrics_id-vm.logit.io:@vmAgentPort/api/v1/write"
  data_format = "prometheusremotewrite"

  [outputs.http.headers]
    Content-Type = "application/x-protobuf"
    Content-Encoding = "snappy"
Read more about how to configure data scraping and configuration options for Apache HTTP Server (opens in a new tab)
Start Telegraf
From the location where Telegraf was installed (C:\Program Files\InfluxData\telegraf\telegraf-1.34.1) run the program
providing the chosen configuration file as a parameter:
.\telegraf.exe --config telegraf.confOnce Telegraf is running you should see output similar to the following, which confirms the inputs, output and basic configuration the application has been started with:

Launch Grafana to View Your Data
Launch GrafanaHow to diagnose no data in Stack
If you don't see data appearing in your stack after following this integration, take a look at the troubleshooting guide for steps to diagnose and resolve the problem or contact our support team and we'll be happy to assist.
Telegraf Apache HTTP Server Overview
For effective monitoring and analyzing Apache HTTP metrics in a distributed environment, it's crucial to have a dependable and capable metrics management solution. Telegraf, an open-source agent for collecting and transmitting metrics, is an ideal choice for gathering Apache HTTP metrics from numerous sources, such as live Apache servers, databases, and other applications.
Telegraf provides a broad spectrum of input plugins, allowing the collection of metrics from diverse sources including CPU usage, memory consumption, network activity, and more. To store and query these accumulated metrics, organizations can leverage Prometheus, an open-source monitoring and alerting system that supports a flexible querying language and graphic data visualization.
To ship Apache metrics from Telegraf to Prometheus, organizations need to configure Telegraf to output metrics in the Prometheus format, then utilize Prometheus to scrape these metrics from the Telegraf server. This procedure involves setting up Telegraf to gather Apache metrics and output them in the Prometheus format, configuring Prometheus to extract these metrics from the Telegraf server, and then analyzing and visualizing the data using Prometheus's flexible querying capabilities.
Once the metrics are in Prometheus, they can be further analyzed and visualized using Grafana. Grafana is an open-source platform for monitoring and observability, and it's perfectly compatible with Prometheus. It provides users with the ability to create dynamic and interactive dashboards to drill down into the metrics data. This integration provides organizations with a powerful toolset to gain valuable insights into Apache performance, enabling them to optimize and troubleshoot their distributed Apache systems effectively.
Using Telegraf to ship Apache metrics to Prometheus, followed by analysis and visualization with Grafana, is a reliable and efficient method for managing metrics in distributed environments. This strategy equips organizations with the ability to optimize their distributed systems and promptly address any arising issues.
If you need any further assistance with shipping your log data to Logit.io we're here to help you get started. Feel free to get in contact with our support team by sending us a message via live chat & we'll be happy to assist.