Python Logging and Traces Configuration Example
Ship Logs and Traces from Python to Logit.io
Follow the steps below to send your observability data to Logit.io
Logs
Send Python logs to your Logit.io Stack.
This sample app was created and tested with Python 3.11.2 and pip 24.2 and python-logstash-async 3.3.0
Install
Create a new directory for your project and name it python_logs_example.
Open a Terminal window or Command Prompt and navigate into the new python_logs_example folder.
Create a virtual environment for your project to manage dependencies, this is done by entering the following command.
python -m venv venv ^
venv\Scripts\activate
We now need to install the necessary logging and Logstash handler packages using pip:
python-logstash-async: Provides a handler for sending logs to Logstash
The main advantage of using an asynchronous handler is that it sends logs to Logstash without blocking the main application thread. We install it with the following command:
pip install python-logstash-asyncCreate two new files in the folder and call them app.py and config.py. There should now be
two files (and a folder called venv) in the python_logs_example folder.
Configuring the App
Copy and Paste the code below into config.py:
# config.py

HOST = "@logstash.host"
PORT = "@logstash.sslPort:strip_quotes"
SSL_ENABLE = True
Copy and Paste the code below into app.py:
import logging
from logstash_async.handler import AsynchronousLogstashHandler
from logstash_async.handler import LogstashFormatter

# Importing configuration variables from config.py
from config import HOST, PORT, SSL_ENABLE

def main():
  try:
    # Create the logger and set it's logging level
    logger = logging.getLogger("logstash")
    logger.setLevel(logging.DEBUG)

    handler = AsynchronousLogstashHandler(
      host=HOST,
      port=PORT,
      ssl_enable=SSL_ENABLE,
      ssl_verify=False,
      transport='logstash_async.transport.BeatsTransport',
      database_path='')

    # Here you can specify additional formatting on your log record/message
    formatter = LogstashFormatter()
    handler.setFormatter(formatter)

    # Assign handler to the logger
    logger.addHandler(handler)

    print("Sending logs to Logit.io.")

    # Send log records to Logstash
    logger.error('python-logstash-async: test error message.')
    logger.info('python-logstash-async: test info message.')
    logger.warning('python-logstash-async: test warning message.')
    logger.debug('python-logstash-async: test debug message.')

    # Flush and close the handler to ensure all logs are sent
    # If the application crashes before buffered logs are flushed,
    # some logs could be lost unless explicitly handled through mechanisms
    # like flush intervals or proper shutdown processes
    handler.flush()  # Flush the log queue
    handler.close()  # Wait for background thread to finish

  except Exception as e:
    print(f"Failed to send log to Logit.io: {e}")

if __name__ == '__main__':
    main()
Run the Python App
Run the Python app with the following command in Terminal or the Command Prompt window.
python app.pyYou will see feedback from the app so that you know that is running.
Once the app has finished running, logs will have been sent to your Stack. The app sends an example of an error log, an info log, a warning log and a debug log.
Launch OpenSearch Dashboards to View Your Data
Launch OpenSearch DashboardsHow to diagnose no data in Stack
If you don't see data appearing in your stack after following this integration, take a look at the troubleshooting guide for steps to diagnose and resolve the problem or contact our support team and we'll be happy to assist.
APM
Install Integration
This sample app was created and tested with
Python 3.9.13 (tags/v3.9.13:6de2ca5, May 17 2022, 16:36:42)
pip 22.0.4
Install
Create a new directory for your project and name it opentelemetry_python_example.
Open a Terminal window or Command Prompt and navigate into the new opentelemetry_python_example folder.
Create a virtual environment for your project to manage dependencies, this is done by entering the following command.
python -m venv venv
venv\Scripts\activate
We now need to install the necessary OpenTelemetry packages using pip, the packages that we will be using are as follows:
opentelemetry-api: Core API for OpenTelemetryopentelemetry-sdk: SDK implementationopentelemetry-exporter-otlp: Exporter to send data to the OpenTelemetry Collector or other OTLP-compatible backendsopentelemetry-instrumentation-flask: Automatically instrument your Flask applications for tracing with OpenTelemetry
We install them with the following command.
pip install flask opentelemetry-api opentelemetry-sdk opentelemetry-instrumentation-flask opentelemetry-exporter-otlpCreate two new files in the folder and call them app.py and config.py. There should now be a
two files in the opentelemetry_python_example folder and a folder called venv.
Configuring the App
Copy and Paste the code below into config.py.
Please ensure you are logged in to your Logit.io account to ensure correct population of the endpoint address, username, password and port values.
# config.py

SERVICE_NAME = "LogitPythonTestApp"
OTLP_ENDPOINT = "https://@opentelemetry.endpointAddress"
PORT = "@opentelemetry.httpsPort"
USERNAME = "@opentelemetry.username"
PASSWORD = "@opentelemetry.password"
Copy and Paste the code below into app.py
# app.py

import base64
from datetime import datetime
from opentelemetry import trace
from opentelemetry.sdk.resources import Resource
from opentelemetry.sdk.trace import TracerProvider
from opentelemetry.sdk.trace.export import BatchSpanProcessor
from opentelemetry.exporter.otlp.proto.http.trace_exporter import OTLPSpanExporter
from flask import Flask

app = Flask(__name__)

# Importing configuration variables from config.py
from config import SERVICE_NAME, OTLP_ENDPOINT, PORT, USERNAME, PASSWORD

def get_basic_auth_header(username, password):
    """Encodes the username and password to base64 for Basic Auth."""
    credentials = f"{username}:{password}"
    auth_bytes = base64.b64encode(credentials.encode('utf-8'))
    auth_header = auth_bytes.decode('utf-8')
    return f"Basic {auth_header}"

def init_tracer():
    # Create a Resource to associate with all traces
    resource = Resource.create({"service.name": SERVICE_NAME})

    # Set up the TracerProvider and add the OTLP HTTP exporter with Basic Auth
    tracer_provider = TracerProvider(resource=resource)
    trace.set_tracer_provider(tracer_provider)

    # Generate the Basic Auth header
    auth_header = get_basic_auth_header(USERNAME, PASSWORD)

    #Generate the full endpoint
    endpoint = f"{OTLP_ENDPOINT}:{PORT}/v1/traces"

    # Create the OTLP HTTP exporter with the Basic Auth header
    otlp_exporter = OTLPSpanExporter(
        endpoint=endpoint,
        headers={"Authorization": auth_header}
    )

    # Add the exporter to the tracer provider
    span_processor = BatchSpanProcessor(otlp_exporter)
    tracer_provider.add_span_processor(span_processor)

@app.route('/')
def hello_world():
    # Initialize the tracer
    init_tracer()
    tracer = trace.get_tracer(__name__)

    with tracer.start_as_current_span("parent-span") as parent_span:
        now = datetime.now()
        parent_span.set_attribute("FirstMessage", "This is a test!")
        parent_span.set_attribute("SecondMessage", "Message sent at " + now.strftime("%H:%M:%S"))

        # Start the second span within the first span
        with tracer.start_as_current_span("child-span") as child_span:
            child_span.set_attribute("FirstMessage", "This is another test!")

    with tracer.start_as_current_span("hello-span"):
        return "Hello, World!"


if __name__ == '__main__':
    app.run()
Run the Python App
Run the Python app with the following command in Terminal or the Command Prompt window.
python app.pyYou will see feedback from the app so that you know that is running, make a note of the address and port that it is running on.
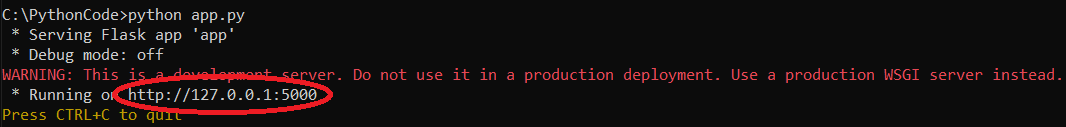
Open your browser and enter the address and port you made a note of in the previous step, the browser will return the following

The action of browsing to the page served by the Python app with sent traces to your Stack.
Launch Logit.io to view your traces
Launch JaegerHow to diagnose no data in Stack
If you don't see data appearing in your stack after following this integration, take a look at the troubleshooting guide for steps to diagnose and resolve the problem or contact our support team and we'll be happy to assist.