Azure Kubernetes
Collect and ship Azure Kubernetes container logs to Logstash and Elasticsearch
Follow the steps below to send your observability data to Logit.io
Logs
Filebeat is a lightweight shipper that helps you monitor Azure Kubernetes Service by collecting logs from the containers running on the host system. Configure Filebeat using the pre-defined examples below to collect and ship Azure Kubernetes logs to Logstash or Elasticsearch.
Install Integration
Download Filebeat Manifest File
Download the filebeat kubernetes deployment manifest using the link below:
Click to download filebeat-kubernetes.yaml (opens in a new tab)
To do this on your Azure Cluster you can use the following command in the Azure Cloud Shell terminal.
wget https://cdn.logit.io/filebeat-kubernetes.yamlInsert stack details
Now you have the manifest you're going to want to add your Stack details. Open the file in a text editor.
Locate the environment variables controlling the logging destination and enter your Stacks Logstash input information.
You need to change the environment variables around lines 54.
env:
- name: LOGSTASH_HOST
  value: "@logstash.host"
- name: BEATS_PORT
  value: "@logstash.sslPort"
Deploy Filebeat pod
Now your Filebeat deployment manifest is updated with your Stack details, you can deploy it using the following command in Azure Cloud Shell:
kubectl apply -f filebeat-kubernetes.yamlConfirm deployment succesful
Confirm that your pod has successfully been deployed using one or all of the following commands in Azure Cloud Shell:
kubectl get po -A

kubectl --namespace=kube-system get ds/filebeat

kubectl --namespace=kube-system get pods
You should see a pod for each Kubernetes node with a name similar to filebeat-abcde listed.
Launch OpenSearch Dashboards to View Your Data
Launch OpenSearch DashboardsHow to diagnose no data in Stack
If you don't see data appearing in your stack after following this integration, take a look at the troubleshooting guide for steps to diagnose and resolve the problem or contact our support team and we'll be happy to assist.
Metrics
Metricbeat is a lightweight shipper that helps you monitor Azure Kubernetes Service by collecting metrics from the containers running on the host system. Configure Metricbeat using the pre-defined examples below to collect and ship Azure Kubernetes service metrics and statistics to Logstash or Elasticsearch.
Install Integration
Install Kube-State-Metrics
You are going to need an instance of Kube State Metrics running in your cluster so that we can access different metrics that aren't accessible using just Metricbeat. Kube-state-metrics is a simple service that listens to the Kubernetes API server and generates metrics about the state of the objects.
In the Azure cloud shell run the following command to download the kube-state-metrics.
go get k8s.io/kube-state-metricsNow change into the newly downloaded directory:
cd go/src/k8s.io/kube-state-metrics/Then to deploy this project to your cluster you simply run:
kubectl apply -f examples/standardRead more about what configuration and options are available for Kube State Metrics (opens in a new tab) There are different settings and configurations you can use specifically for your cluster but for this example the default settings are being used.
Download Manifest File
Download the metricbeat kubernetes deployment manifest using the link below:
Click to download metricbeatbeat-kubernetes-7.10.0.yaml (opens in a new tab)
Insert stack details
Now you have the manifest you're going to want to add your Stack details. Open the file in a text editor.
Locate the environment variables controlling the logging destination and enter your Stacks Logstash input information.
You need to change the environment variables around lines 54.
env:
- name: LOGSTASH_HOST
  value: "@logstash.host"
- name: BEATS_PORT
  value: "@logstash.sslPort"
This is because Kubernetes runs a Metricbeat instance on each node in the cluster and also an additional single instance of Metricbeat to retrieve metrics for the cluster itself.
Deploy pod
Now your Metricbeat deployment manifest is updated with your Stack details, you can deploy it using the following command in Azure Cloud Shell:
kubectl apply -f metricbeat-kubernetes-7.10.0.yamlConfirm deployment succesful
Confirm that your pod has successfully been deployed using one or all of the following commands in Azure Cloud Shell:
kubectl get po -A

kubectl --namespace=kube-system get ds/metricbeat

kubectl --namespace=kube-system get pods
You should see a pod for each Kubernetes node with a name similar to metricbeat-abcde listed.
Launch OpenSearch Dashboards to View Your Data
Launch OpenSearch DashboardsExample Log
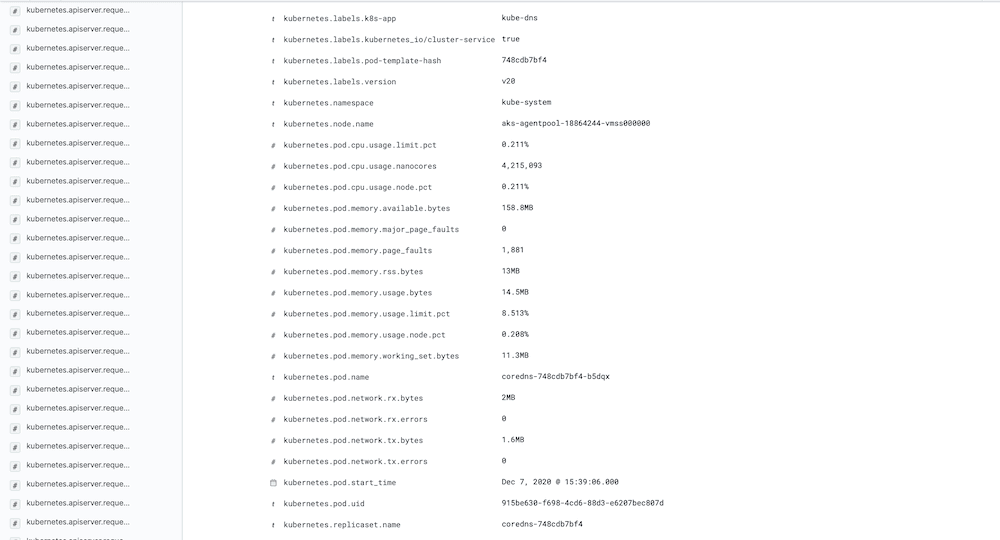
You should now start to see logs arriving in Kibana from your Kubernetes cluster, similar to the example below.