IIS Log Configuration
Ship logs from your IIS Websites to Logstash
Follow the steps below to send your observability data to Logit.io
Logs
Send your IIS logs to Logit.io via logstash using the instructions below.
Install Integration
Install Filebeat
To get started you will need to install filebeat. To do this you have two main options:
- Choose the filebeat (opens in a new tab) ZIP file (Windows ZIP x86_64) or
- Choose the Microsoft Software Installer MSI (opens in a new tab) file (Windows MSI x86_64 (beta))
To successfully install filebeat and set up the required Windows service you will need to have administrator access.
If you have chosen to download the zip file:
- Extract the contents of the zip file into C:\Program Files.
- Rename the extracted folder to filebeat
- Open a PowerShell prompt as an Administrator (right-click the PowerShell icon and select Run As Administrator).
- From the PowerShell prompt, run the following commands to install filebeat as a Windows service:
cd 'C:\Program Files\filebeat'.\install-service-filebeat.ps1If script execution is disabled on your system, you need to set the execution policy for the current session to allow the script to run. For example:
PowerShell.exe -ExecutionPolicy UnRestricted -File .\install-service-filebeat.ps1For more information about Powershell execution policies see here (opens in a new tab).
If you have chosen to download the filebeat.msi file:
- double-click on it and the relevant files will be downloaded.
At the end of the installation process you'll be given the option to open the folder where filebeat has been installed.
- Open a PowerShell prompt as an Administrator (right-click the PowerShell icon and select Run As Administrator).
- From the PowerShell prompt, change directory to the location where filebeat was installed and run the following command to install filebeat as a Windows service:
.\install-service-filebeat.ps1If script execution is disabled on your system, you need to set the execution policy for the current session to allow the script to run. For example:
PowerShell.exe -ExecutionPolicy UnRestricted -File .\install-service-filebeat.ps1For more information about Powershell execution policies see here (opens in a new tab).
The default configuration file is located at:
C:\Program Files\filebeat\filebeat.yml
Enable IIS module in Filebeat
We need to enable the IIS module in Filebeat so that filebeat know to look for IIS logs. In Powershell run the following command:
.\Filebeat modules enable iis
The iis.yml module file in the modules.d folder in your Filebeat installation directory will need to be updated.
You must enable at least one fileset in the module. Filesets are disabled by default. Below is an example with
both the access and error logs enabled. You will need to update the var.paths to the location where the logs are stored.
The commented out var.paths are the default locations for the logs.
- module: iis
  # Access logs
  access:
    enabled: true

  # Set custom paths for the log files. If left empty,
  # Filebeat will choose the paths depending on your OS.
  # var.paths: ["C:/inetpub/logs/LogFiles/*/*.log"]

  # Error logs
  error:
    enabled: true

  # Set custom paths for the log files. If left empty,
  # Filebeat will choose the paths depending on your OS.
  # var.paths: ["C:/Windows/System32/LogFiles/HTTPERR/*.log"]
Update Your Configuration File
The configuration file below is pre-configured to send data to your Logit.io Stack via Logstash.
Copy the configuration file below and overwrite the contents of filebeat.yml.
# ============================== Filebeat modules ==============================
filebeat.config.modules:
  path: ${path.config}/modules.d/*.yml
  reload.enabled: false
  #reload.period: 10s

# ================================== Outputs ===================================
# ------------------------------ Logstash Output -------------------------------
output.logstash:
  hosts: ["@logstash.host:@logstash.sslPort"]
  loadbalance: true
  ssl.enabled: true

# ================================= Processors =================================
processors:
  - add_host_metadata:
      when.not.contains.tags: forwarded
  - add_cloud_metadata: ~
  - add_docker_metadata: ~
  - add_kubernetes_metadata: ~
If you're running Filebeat 7 add this code block to the end. Otherwise, you can leave it out.
# ... For Filebeat 7 only ...
filebeat.registry.path: /var/lib/filebeat
If you're running Filebeat 6 add this code block to the end. Otherwise, you can leave it out.
# ... For Filebeat 6 only ...
registry_file: /var/lib/filebeat/registry
Validate your YAML
It's a good idea to run the configuration file through a YAML validator to rule out indentation errors, clean up extra characters, and check if your YAML file is valid. Yamllint.com (opens in a new tab) is a great choice.
Validate configuration
.\@beatname.exe test config -c @beatname.ymlIf the yml file is invalid, @beatname will print a description of the error. For example, if the
output.logstash section was missing, @beatname would print no outputs are defined, please define one under the output section
Start filebeat
To start Filebeat, run in Powershell:
Start-Service filebeatLaunch OpenSearch Dashboards to View Your Data
Launch OpenSearch DashboardsHow to diagnose no data in Stack
If you don't see data appearing in your stack after following this integration, take a look at the troubleshooting guide for steps to diagnose and resolve the problem or contact our support team and we'll be happy to assist.
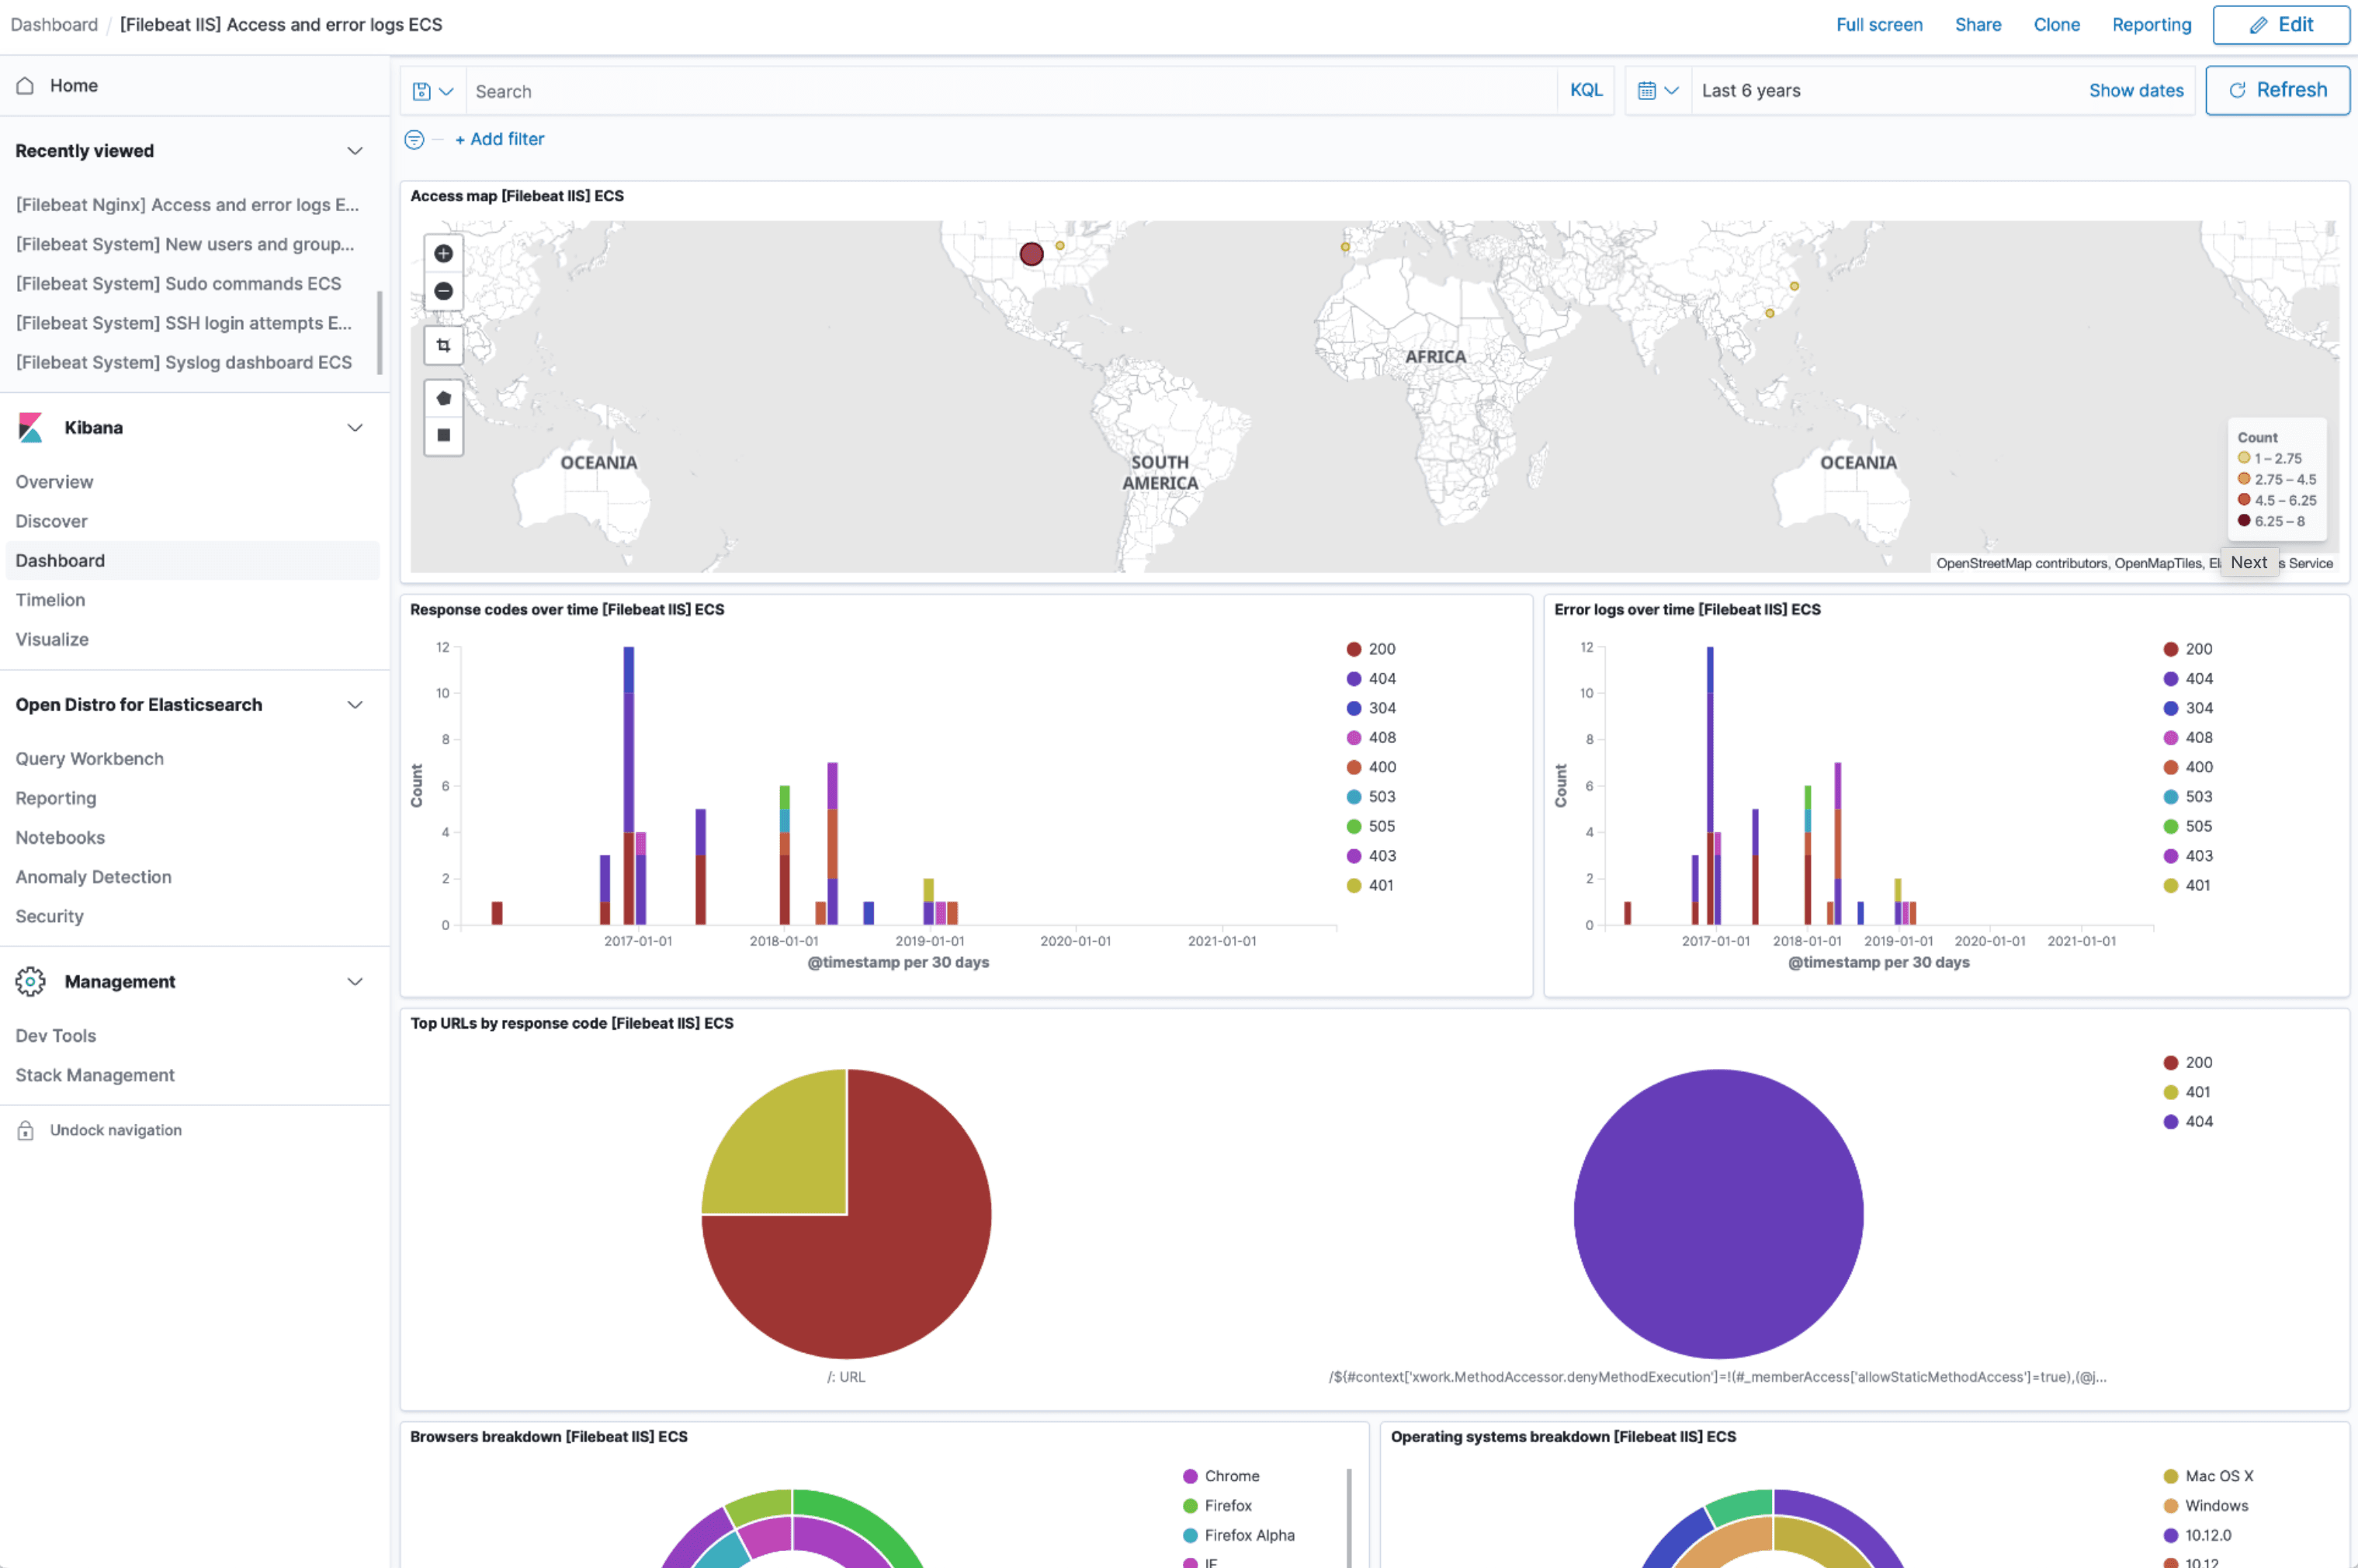
IIS dashboard
The IIS module comes with predefined Kibana dashboards. To view your dashboards for any of your Logit.io stacks, launch Logs and choose Dashboards.